The covariates and what they mean
The speciation and extinction rates of every emphasis model are links of a linear predictor in up to four covariates, each read on the complete tree, hidden lineages included (the overview, section 2). Each covariate encodes a hypothesis about diversification that the literature has argued for decades. This page introduces the four; each has its own page with the hypothesis, the exact definition, what the sign of its coefficient means and what else produces it, what it cannot be separated from, and what simulation and real phylogenies say.
| covariate | page | in one line |
|---|---|---|
| \(N(t)\) | N: the number of lineages alive | Clade-level. Asks whether a clade's rates change as it fills: ecological limits and diversity dependence. |
| \(D_s(t)\) | D: the centred pendant age | Lineage-level, sums to zero. Asks whether a lineage that has gone longer without splitting than its contemporaries splits sooner or later: age-dependent and protracted speciation, and Van Valen's law on extinction. |
| \(\mathrm{ED}_s(t)\), \(\mathrm{ED}^c_s(t)\) | ED: evolutionary distinctiveness | Lineage-level, raw or centred. Asks whether a lineage that represents a large share of the clade's phylogenetic diversity speciates or dies at a different rate: the relict question of the EDGE programme. |
| \(K_s(t)\) | K: the number of ancestral splits | Lineage-level. Asks whether a lineage from a speciation-rich ancestry splits sooner: the heritability of diversification rate that rate-shift models carry as a latent variable. |
\(N\) says when the clade diversifies; \(D\), ED and \(K\) say which of its lineages do. Every covariate a model uses enters both rates, but on the trees analysed so far no extinction coefficient has been read: the reconstructed trees of 50 to 400 tips carry too little information on extinction (see N, ED).
What each reads and what each shares
| \(N\) | \(D\) | \(\mathrm{ED}\) | \(K\) | |
|---|---|---|---|---|
| level | clade | lineage | lineage | lineage |
| reads | the count of lineages alive | the last edge of the lineage | every edge on its path, each shared among its descendants | the number of nodes on its path |
| units | count | time | time | count |
| centred | no | yes, by definition | raw no; \(\mathrm{ED}^c\) yes | no |
| changes | at events | at events, for every lineage | grows at slope one between events (raw), jumps at events | at the lineage's own splits |
| needs a topology | no | yes | yes | yes |
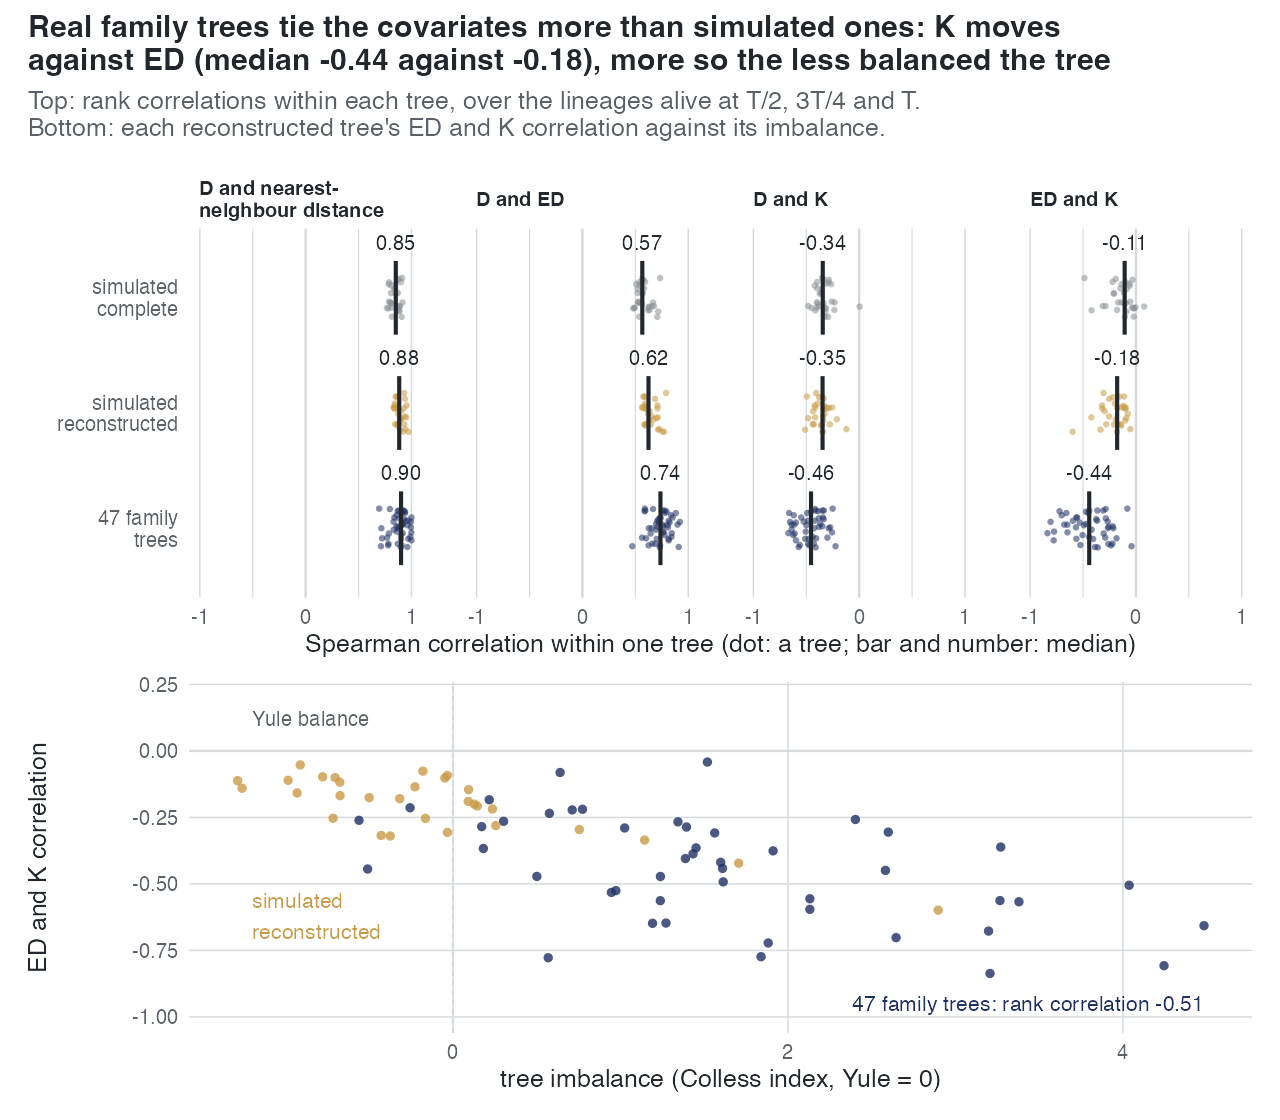
| cannot be separated from | time since the crown, on one tree | ED (shared pendant edge, within-tree rank correlation 0.57 to 0.74) | \(D\); and \(K\) on unbalanced trees | ED on unbalanced trees (correlation \(-0.18\) on simulated, \(-0.44\) median on family trees); time, through its clade mean |
| simulation | estimated against an exact maximum; dd chosen on 0.90 of its own trees at 100 tips |
under the current likelihood, conditioned on survival: within a factor of 2 on 40% to 94% of fits by model, sign of the effect and turnover (V5, interim) | sign on at least 0.95 of trees; selection over dd needs an effect of 0.35 to 0.60 of the speciation rate |
recovered at 0.92 to 0.95 by fitting, 0.65 to 0.76 on budget-stopped ladder fits; nk chosen on 11 to 15 of 20 of its trees |
| real trees | dd leads cr in 32 of 46 families, \(\beta_N < 0\) in all 46 |
factor below 1 on 92 of 109 read fits, median 0.78, from fits of which 7 of 170 met the stopping rule | factor below 1 on all 45 read trees that chose ned, median 0.49 |
factor above 1 on all 54 read trees that chose nk, median 1.63 |
The within-tree correlations are from E39; the simulation and real-tree numbers are from the experiments each page cites, summarised on What is established and Real phylogenies.
The two pairs the trees do not separate
\(D\) and ED share the pendant edge. \(\mathrm{ED}_s\) is the pendant age \(E_s\) plus the lineage's shares of the branches above it, and \(D_s\) is \(E_s\) centred. On simulated trees of 100 to 400 tips the covariate path does not apportion an effect between them, and on 144 of 170 real trees it keeps both together. A comparison of nd against ned on one clade is a comparison of two readings of the same edge.
\(K\) and ED on unbalanced trees. A lineage deep in a radiation has many ancestral splits and a small share of every branch above it; a lineage alone on a long branch has few and a large share. On the balanced trees the simulators produce, the two are nearly independent; on real family trees, which are much less balanced, they rank the lineages in partly the same order, and more so the less balanced the tree.
The models are hypotheses about which lineage splits and when, not about why. Each page names, beside the mechanism a sign is read as, at least one other process that produces the same sign.