N: the number of lineages alive
In one line. \(N(t)\) counts the lineages alive at time \(t\), hidden ones included, and its coefficient asks whether a clade's speciation or extinction rate changes as the clade fills: the ecological-limits hypothesis.
\(N\) is the one clade-level covariate of the package. Every lineage alive at \(t\) reads the same value, so \(\beta_N\) and \(\gamma_N\) say when the clade diversifies and nothing about which of its lineages does. The three lineage-level covariates, D, ED and K, are fitted beside it in the models nd, ned and nk; the covariates page compares the four.
The question in the literature
The idea that a clade's diversification is regulated by the space available to it is older than molecular phylogenies. Sepkoski (1978) fitted logistic growth to the number of marine orders through the Phanerozoic, and Walker and Valentine (1984) asked how many niches an equilibrium biota leaves empty. In the phylogenetic literature it became the diversity-dependent birth-death model, in which the speciation rate declines with the number of lineages toward a carrying capacity (Rabosky and Lovette 2008; Etienne et al. 2012; Etienne and Haegeman 2012), and the broader claim that clade richness is regulated rather than free-growing (Rabosky 2009a, 2013).
The mechanism proposed is competition among ecologically similar species for resources or space, which lowers the rate at which populations become isolated and persist, or raises the rate at which species go extinct. McPeek (2008) showed that the same slowdown arises from community assembly when new species enter a saturating community; Rabosky (2013) argued that the feedback acts on speciation, through the ecological opportunity left to new species, rather than on extinction. The scale of the interaction is part of the hypothesis: species interact where they co-occur, and Xu and Etienne (2018) showed that a global count of lineages still detects diversity dependence that is local, provided dispersal among localities is not too low, at the price of estimates that depend on the dispersal rate.
Whether continental richness is at its limit was argued in both directions in the same issue of The American Naturalist: by Rabosky and Hurlbert (2015), from the stationarity of richness through time and its correlation with area and productivity, and by Harmon and Harrison (2015), from the openness of communities to invaders. Both sides agree that the phylogenetic evidence alone does not decide it.
What the package computes
\(N(t) = |A(t)|\), the number of lineages alive at \(t\) on the complete tree: the lineages of the reconstructed tree, the lineages that arose and went extinct before the present while they were alive, and the lineages alive at the present that were not sampled. It is a count, it carries no units, and it is not centred. It changes only at events: by \(+1\) at every speciation and by \(-1\) at every extinction, observed or hidden, and it is constant on every segment between two consecutive events. The clade starts at the crown with \(N = 2\).
In the model of the overview the predictor of every lineage's speciation rate contains \(\beta_N N(t)\), and that of its extinction rate \(\gamma_N N(t)\). On the exponential link, which every experiment and real-tree analysis cited below uses, one more lineage alive multiplies every lineage's speciation rate by \(e^{\beta_N}\) and its extinction rate by \(e^{\gamma_N}\). On the linear link, dd with \(\gamma_N = 0\) is the model of Etienne et al. (2012), whose speciation rate \(\max\{0, \lambda_0 - (\lambda_0 - \mu_0)N/\text{capacity}\}\) is the linear dd with \(\beta_0 = \lambda_0\), \(\beta_N = -(\lambda_0 - \mu_0)/\text{capacity}\) and \(\gamma_0 = \mu_0\); speciation falls to the extinction rate at \(N = \text{capacity}\). On either link, when both rates move with \(N\), the clade's expected size stops growing where \(\lambda(N) = \mu(N)\), which on the exponential link is
\[ N^\ast = \frac{\beta_0 - \gamma_0}{\gamma_N - \beta_N}. \]
Because \(N\) is read on the complete tree, its value at a given time is not the number of lineages in the reconstructed tree at that time: the hidden lineages count. Below \(\rho = 1\) part of \(N\) is drawn rather than observed, and \(\rho\) enters every \(N\) fit through the hidden lineages the proposal draws. For cr and dd an exact likelihood exists (Nee et al. 1994; Etienne et al. 2012), which makes \(N\) the one covariate whose estimates can be checked against an exact maximum on the same tree.
What the sign of a coefficient means
Speciation. A negative \(\beta_N\) is the ecological-limits hypothesis: each additional lineage lowers the speciation rate of every lineage. A positive \(\beta_N\) says that diversity begets diversity, the signature of a positive feedback such as co-evolutionary escalation within a radiation, or of a speciation rate that rises in time for a reason \(N\) happens to track. Zero is the constant-rate null of Nee et al. (1994).
Extinction. A positive \(\gamma_N\) is crowding-driven extinction, the alternative form of diversity dependence in Etienne et al. (2012). A negative \(\gamma_N\) would say that a full clade protects its members, which no mechanism in the literature proposes.
What else produces a negative \(\beta_N\). On one reconstructed tree a negative \(\beta_N\) is the slowdown in lineage accumulation toward the present that the \(\gamma\) statistic of Pybus and Harvey (2000) measures, and several processes produce it without any diversity feedback. Moen and Morlon (2014) listed them: speciation that takes time to complete, which leaves the youngest splits unrecorded (Etienne and Rosindell 2012); a rate that falls in time for environmental reasons, such as temperature, which Condamine et al. (2019) found to receive support equivalent to diversity dependence on the family trees this site later uses; incomplete sampling, since a tree missing more than about 20% of its species, when they are not missing at random, is biased toward slowdowns (Cusimano and Renner 2010); and the choice of clades, since large clades show stronger slowdowns than small ones under constant rates, a clade that diversified fast early being both large and due to regress to the mean (Phillimore and Price 2008). Heritable, pulsed extinction produces an early burst that resembles niche filling (Rabosky 2009b). Conditioning on the crown age biases the carrying capacity toward the observed richness (Etienne et al. 2016); the fits on this site condition on neither survival nor crown age, so that particular bias is not the one they carry, and what the unconditioned fit does to \(\beta_N\) is being measured (see below).
What N cannot be separated from
Time. Under any time-varying birth-death model the reconstructed tree identifies only a one-dimensional family of pulled rates, and dependence on \(N\) is one parametrisation of a time-varying rate on any single tree (Louca and Pennell 2020). Pannetier et al. (2021) built a time-dependent, diversity-independent model whose expected diversity through time matches a diversity-dependent one and found that standard model selection chose diversity dependence when it was absent. On one clade, \(N\) and the time since the crown both rise while the clade grows, and the tree alone does not say which of the two the rate follows. A comparison across clades of different size and age is what separates them, and the package does not offer a time covariate to set against \(N\).
The clade-level parts of the other covariates. \(N\) is constant across the lineages alive at one instant, so a within-tree, same-time correlation between \(N\) and a lineage-level covariate is not defined; E39 measures the lineage-level pairs only. What \(N\) shares with the other covariates is their clade mean. \(D\) sums to zero over the lineages alive and so carries none of the clade-level signal: \(\beta_N\) and \(\beta_D\) answer different questions by construction. Raw \(\mathrm{ED}\) has clade mean \(\mathrm{PD}/N\), phylogenetic diversity per lineage, which falls with diversity and rises with the clade's age, so a ned fit's \(\beta_{ED}\) carries a clade-level component beside the within-clade contrast; the centred covariate of edc and nedc removes it. \(K\) has a clade mean that grows with time: under constant rates the number of ancestral splits among the lineages alive at \(t\) is Poisson with mean \(2\lambda t\), so \(\beta_K\) also carries a clade-level trend that \(N\) and time track. No centred \(K\) is offered.
Sampling. On simulated trees, a sampling fraction told as 0.82 when it was 0.92 moved \(\beta_N\) by a median 19%, with 5 of 20 trees outside a band of 0.75 to 1.25 of their value; told 1.00 it did not, and the chosen model was the same on at least 18 of 20 trees in every arm (E35, part b).
What simulation says
Against the exact estimate. Under cr and dd at 20 to 100 tips, Monte Carlo EM on the surrogate proposal gives up a median 0.00 to 0.07 nats against the exact maximum at 20 and 50 tips and 0.05 to 0.32 nats at 100, with rates within 0 to 7.5% (speciation) and 0 to 10.5% (extinction) of the exact estimate (E1). At turnover 0.25, against the exact DDD::dd_ML on the same trees, the fitted dd intercept and slope on \(N\) have a median ratio to their generating values of 0.97 and 0.99 at 100 tips; at 200 and 400 tips, on fits that mostly ended on the iteration cap, the ratios are 1.13 and 1.22, then 1.23 and 1.58 (S). The exact three-parameter dd_ML errs low on the same trees, 0.74 and 0.68 at 100 tips.
Selection. At 100 tips the one-call ladder chooses dd on 0.90 of trees generated by dd and cr on 0.80 of cr trees (E23), on unconditioned fits with the nd rung under the likelihood before 4e0b9dd. Conditioned on survival, the ladder keeps dd on 16 of 19 dd trees at 100 tips and turnover 0.10 and chooses cr on the other 3 (V7). Across the conditions of E27, trees generated with diversity dependence and no lineage-level effect keep dd on at least 16 of 20 at the reference cell, at family-like settings, at 50% sampling and at 200 tips; at turnover 0.25 and 0.40 they move to cr, and dd is kept on 8 and 6 of 20. On the covariate path \(N\) is in the selected set on 0.85 to 1.00 of dd trees from 50 to 400 tips and enters first on 0.95 to 1.00 at 50, 200 and 400 tips, although \(N\) alone is the selected set on only 0.40 to 0.70 (E20, E22); these paths read \(D\) at the segment midpoint, as the package did before 4e0b9dd, and V8 reruns them.
Extinction. Diversity dependence is the one case in which a reconstructed tree carries information on extinction at moderate size: with the exact likelihood, zero extinction is excluded on every simulated dd tree from 100 tips at every turnover tested, against never up to 1,600 tips at turnover 0.10 under constant rates (E38).
Under conditioning. Every number above maximises the likelihood unconditioned on the survival of the clade. Conditioned on survival, under cr at 25 to 800 tips Monte Carlo EM sits at the exact conditioned maximum in every cell, and the speciation rate is reliable from 25 tips; under dd it does in 11 of 14 cells at complete sampling, speciation at low diversity is within a factor of 2 from 50 tips, and the slope on diversity is recovered at turnover 0.10 (median 0.84 to 0.91 of its value) (E45, Estimability).
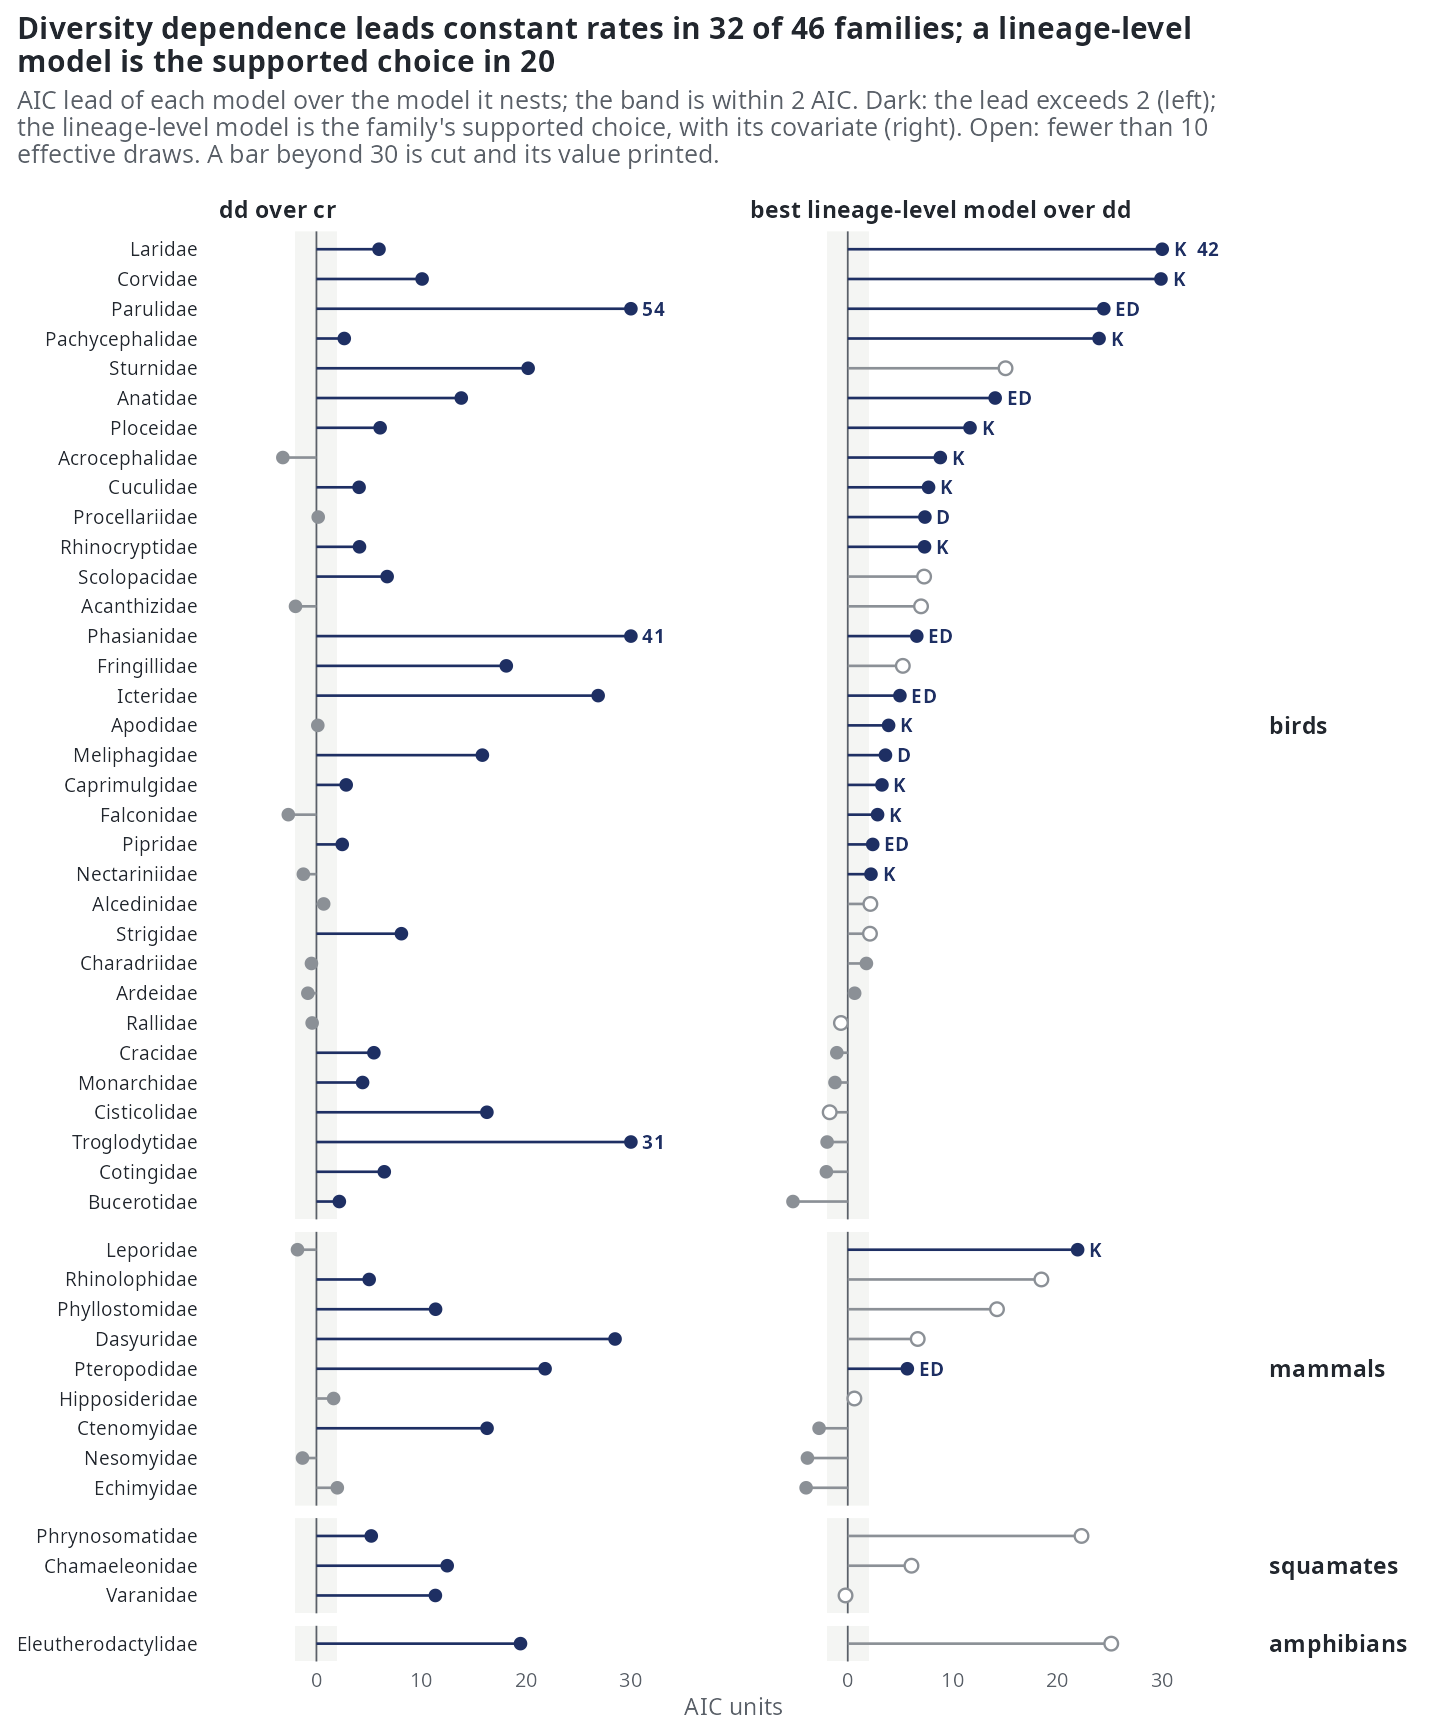
dd over cr, dark where it exceeds 2. Right: the lead of the best of nd, ned and nk over dd, dark where the lineage-level model is the family's supported choice; open points rest on fewer than 10 effective draws. From E26, with the nd rung refitted in E48.What real phylogenies say
The 46 family trees. The analysis of record is every dated family tree of Condamine et al. (2019) in the phylogeny catalogue with 50 to 200 tips and a sampling fraction of at least 0.5, less the one whose tip depths spread by more than the 15% of its crown age the design allows (the kangaroos and wallabies, Macropodidae, 19%): 33 families of birds, 9 of mammals, 3 of squamates and 1 of amphibians (E26, E28). dd leads cr by more than 2 AIC in 32 of the 46, and the fitted \(\beta_N\) is negative in all 46 (Figure 1, left). The size of the lead is the slowdown the \(\gamma\) statistic reports, restated as a model: across families the two have a rank correlation of \(-0.88\). The largest leads are in young, strongly slowed radiations: the New World warblers (Parulidae, 54 AIC, \(\gamma = -7.7\), crown age 12.7 million years), the pheasants and partridges (Phasianidae, 41), the wrens (Troglodytidae, 31), the dasyurid marsupials (Dasyuridae, 28) and the New World blackbirds (Icteridae, 27). The wood warblers are the clade in which Rabosky and Lovette (2008) first argued for density-dependent diversification from the shape of a molecular phylogeny. The 14 families in which dd does not lead have the weakest slowdowns, a median \(\gamma\) of \(-1.6\) against \(-3.9\) in the others.
Against the exact maximum. On the 75 real trees finished when the check ran, the Monte Carlo dd fit sits a median 0.005 nats below the exact maximum on the 48 complete trees (E42). The exact dd maximum puts the extinction slope on \(N\) at its cap on 61 of 69 valid trees, and the extinction rate at the present at a median \(2 \cdot 10^{-6}\) against a speciation rate of 0.059 per million years: the likelihood of these trees is flat toward zero extinction, so \(\gamma_N\) is not read on any of them.
The 170 bird and mammal trees. On the larger set of E40, 116 clades cut from the bird and mammal class trees (McTavish et al. 2025; Upham et al. 2019) and 59 family trees, 170 of them finished, dd is the parsimonious choice on 30 trees and cr on 15; the other 125 choose a lineage-level model, each of which contains \(N\). On the covariate path \(N\) is the first covariate to enter on 98 of the 170 trees (Real phylogenies).
How to read it. Every one of these leads is a slowdown on a reconstructed tree, which ecological limits predict and which protracted speciation, undersampled recent splits, a falling rate in time and a declining clade also predict; histories that differ in when diversification happened can fit one tree equally well (Louca and Pennell 2020). What the fits establish is that most of these families slowed toward the present, by an amount the model expresses as a coefficient on \(N\), not that competition caused it.
Not yet read. Every family fit is unconditioned on survival; on simulated surviving clades the conditioned estimate recovers \(\beta_N\) at turnover 0.10 (median 0.84 to 0.91 of its value) and falls short at 0.25 (0.35 to 0.70) (E45). Every simulation that calibrates these readings ran at crown age 15, while 42 of the 46 families are older (median 36 million years). And where a family's sampling fraction is uncertain by 0.1, its \(\beta_N\) carries the sensitivity of E35.
References
- Sepkoski J.J. (1978). A kinetic model of Phanerozoic taxonomic diversity I. Analysis of marine orders. Paleobiology 4, 223–251. doi:10.1017/S0094837300005972
- Walker T.D. and Valentine J.W. (1984). Equilibrium models of evolutionary species diversity and the number of empty niches. The American Naturalist 124, 887–899. doi:10.1086/284322
- Rabosky D.L. and Lovette I.J. (2008). Density-dependent diversification in North American wood warblers. Proceedings of the Royal Society B: Biological Sciences 275, 2363–2371. doi:10.1098/rspb.2008.0630
- Rabosky D.L. (2009a). Ecological limits and diversification rate: alternative paradigms to explain the variation in species richness among clades and regions. Ecology Letters 12, 735–743. doi:10.1111/j.1461-0248.2009.01333.x
- Rabosky D.L. (2013). Diversity-dependence, ecological speciation, and the role of competition in macroevolution. Annual Review of Ecology, Evolution, and Systematics 44, 481–502. doi:10.1146/annurev-ecolsys-110512-135800
- Etienne R.S. et al. (2012). Diversity-dependence brings molecular phylogenies closer to agreement with the fossil record. Proceedings of the Royal Society B: Biological Sciences 279, 1300–1309. doi:10.1098/rspb.2011.1439
- Etienne R.S. and Haegeman B. (2012). A conceptual and statistical framework for adaptive radiations with a key role for diversity dependence. The American Naturalist 180, E75–E89. doi:10.1086/667574
- McPeek M.A. (2008). The ecological dynamics of clade diversification and community assembly. The American Naturalist 172, E270–E284. doi:10.1086/593137
- Xu L. and Etienne R.S. (2018). Detecting local diversity-dependence in diversification. Evolution 72, 1294–1305. doi:10.1111/evo.13482
- Moen D. and Morlon H. (2014). Why does diversification slow down? Trends in Ecology & Evolution 29, 190–197. doi:10.1016/j.tree.2014.01.010
- Etienne R.S. and Rosindell J. (2012). Prolonging the past counteracts the pull of the present: protracted speciation can explain observed slowdowns in diversification. Systematic Biology 61, 204–213. doi:10.1093/sysbio/syr091
- Pannetier T., Martinez C., Bunnefeld L. and Etienne R.S. (2021). Branching patterns in phylogenies cannot distinguish diversity-dependent diversification from time-dependent diversification. Evolution 75, 25–38. doi:10.1111/evo.14124
- Condamine F.L., Rolland J. and Morlon H. (2019). Assessing the causes of diversification slowdowns: temperature-dependent and diversity-dependent models receive equivalent support. Ecology Letters 22, 1900–1912. doi:10.1111/ele.13382
- Louca S. and Pennell M.W. (2020). Extant timetrees are consistent with a myriad of diversification histories. Nature 580, 502–505. doi:10.1038/s41586-020-2176-1
- Cusimano N. and Renner S.S. (2010). Slowdowns in diversification rates from real phylogenies may not be real. Systematic Biology 59, 458–464. doi:10.1093/sysbio/syq032
- Etienne R.S., Pigot A.L. and Phillimore A.B. (2016). How reliably can we infer diversity-dependent diversification from phylogenies? Methods in Ecology and Evolution 7, 1092–1099. doi:10.1111/2041-210X.12565
- Phillimore A.B. and Price T.D. (2008). Density-dependent cladogenesis in birds. PLoS Biology 6, e71. doi:10.1371/journal.pbio.0060071
- Rabosky D.L. (2009b). Heritability of extinction rates links diversification patterns in molecular phylogenies and fossils. Systematic Biology 58, 629–640. doi:10.1093/sysbio/syp069
- Rabosky D.L. and Hurlbert A.H. (2015). Species richness at continental scales is dominated by ecological limits. The American Naturalist 185, 572–583. doi:10.1086/680850
- Harmon L.J. and Harrison S. (2015). Species diversity is dynamic and unbounded at local and continental scales. The American Naturalist 185, 584–593. doi:10.1086/680859
- Pybus O.G. and Harvey P.H. (2000). Testing macro-evolutionary models using incomplete molecular phylogenies. Proceedings of the Royal Society of London B: Biological Sciences 267, 2267–2272. doi:10.1098/rspb.2000.1278
- Nee S., May R.M. and Harvey P.H. (1994). The reconstructed evolutionary process. Philosophical Transactions of the Royal Society of London B: Biological Sciences 344, 305–311. doi:10.1098/rstb.1994.0068
- McTavish E.J. et al. (2025). A complete and dynamic tree of birds. Proceedings of the National Academy of Sciences 122, e2409658122. doi:10.1073/pnas.2409658122
- Upham N.S., Esselstyn J.A. and Jetz W. (2019). Inferring the mammal tree: species-level sets of phylogenies for questions in ecology, evolution, and conservation. PLOS Biology 17, e3000494. doi:10.1371/journal.pbio.3000494