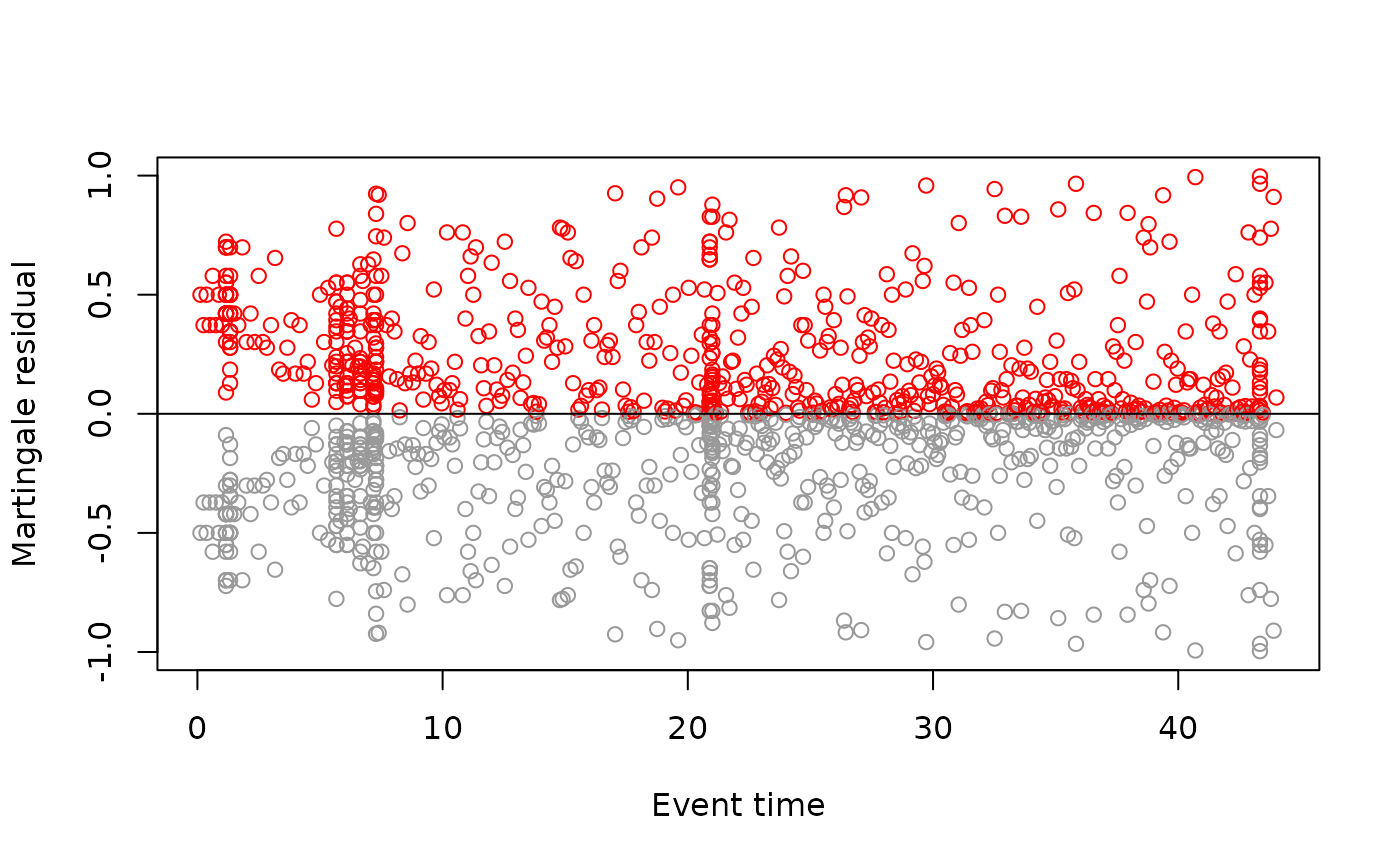
Martingale residuals from a case-control partial-likelihood fit
Source:R/martingale_residuals.R
martingale_residuals.RdComputes per-observation martingale residuals \(M_i = y_i - \pi_i\) from a one-control-per-case partial-likelihood fit, where \(y_i\) is the case indicator inside the (case, control) pair and $$ \pi_i \;=\; \frac{\exp(\eta_i)}{\exp(\eta_{\mathrm{case}}) + \exp(\eta_{\mathrm{ctrl}})} $$ is the fitted probability that observation \(i\) is the event in its risk set. The residuals sum to zero within each stratum.
Arguments
- event_log
Dyadic event log (see
standardize_event_log()).- model
A named character vector mapping statistic name to
"linear". Mirrors a single entry ofcompare_models()'smodelsargument. Non-linear effect types are currently rejected.- scope, mode, half_life, seed
Same meaning as in
compare_models(); control the case-control sampling and the feature computation.
Value
A data frame with one row per observation in the case-control
table (so 2N rows for N events), with columns:
stratum, role ("case" or "control"), sender, receiver,
time, eta, fitted_prob, residual.
Details
Useful as a goodness-of-fit diagnostic: plotting residuals vs. time or
vs. a covariate reveals systematic miscalibration. The convention
matches survival::residuals.coxph(type = "martingale") for the
two-element risk set induced by 1-control case-control sampling.
Only the linear partial-likelihood path (compare_models()-style
linear-effect specs) is supported by this helper; for smooth-effect
fits the case-vs-control matrix design used by
compare_models_smooth() does not have a clean per-observation
martingale interpretation.
References
Therneau TM, Grambsch PM, Fleming TR (1990). Martingale-based residuals for survival models. Biometrika 77(1), 147–160.
Examples
# \donttest{
data(classroom_events)
res <- martingale_residuals(
  classroom_events,
  model = c(reciprocity_count = "linear",
            transitivity_count = "linear"),
  seed = 1)
plot(res$time, res$residual,
     col = ifelse(res$role == "case", "red", "grey60"),
     ylab = "Martingale residual", xlab = "Event time")
abline(h = 0)

# }
# }