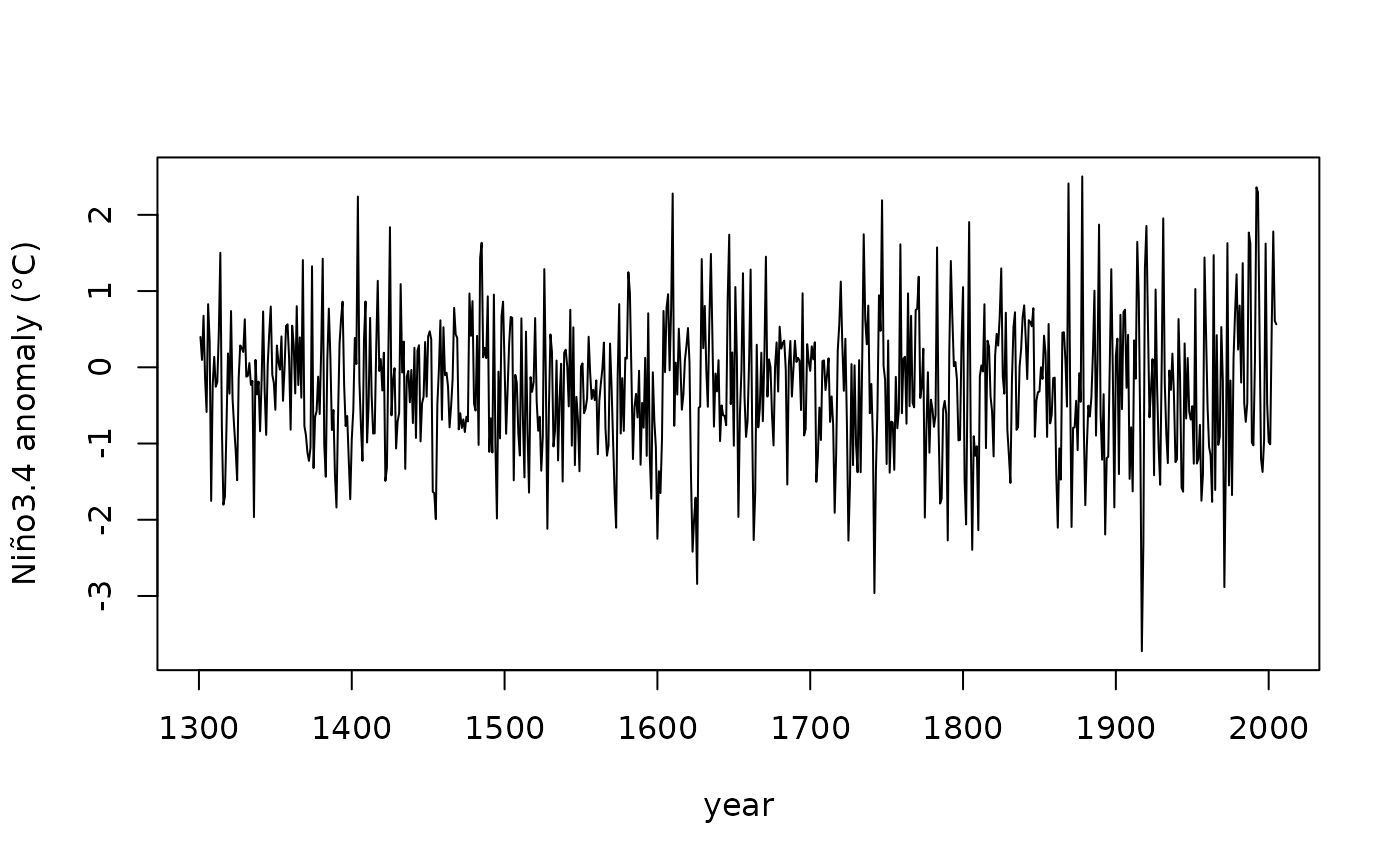
Annual reconstruction of the El Niño/Southern Oscillation from 2,222
tree-ring chronologies across Asia, New Zealand and the Americas. Each value
is the November–January Niño3.4 sea-surface temperature anomaly of the
winter that ends in January of year. A global covariate on a yearly clock:
it takes one value at each time for every dyad, so its effect on a
relational event process is identified only through time-shifted
case-control sampling, sample_non_events() with shift = "exponential".
Format
A data frame with 705 rows and 2 columns:
- year
Integer year CE, 1301–2005.
- nino34
Reconstructed November–January Niño3.4 sea-surface temperature anomaly (°C), relative to the 1971–2000 observed mean. The file gives no uncertainty for the reconstruction.
Source
NOAA National Centers for Environmental Information, World Data
Service for Paleoclimatology, study 14632,
https://www.ncei.noaa.gov/access/paleo-search/study/14632,
doi:10.25921/jfqm-9178
; file enso-li2013.txt, accessed 2026-10-16.
NCEI states that all data products of its Paleoclimatology Product Area
are publicly available without restriction.
Details
To use it as a piecewise-constant covariate in
simulate_relational_events(), pass
data.frame(time_start = enso_nino34$year, nino34 = enso_nino34$nino34)
as global_covariates, which holds each winter's value through the
calendar year that it opens. For event data after 1950, NOAA's
instrumental Oceanic Niño Index (monthly) is the better covariate.
The raw file is shipped as
system.file("extdata", "enso_nino34", "enso-li2013.txt", package = "amorem");
data-raw/enso_nino34.R in the source repository rebuilds this object.
References
Li J, Xie S-P, Cook ER, Morales MS, Christie DA, Johnson NC, Chen F, D'Arrigo R, Fowler AM, Gou X, Fang K (2013). El Niño modulations over the past seven centuries. Nature Climate Change 3, 822–826. doi:10.1038/nclimate1936 .