Data: face-to-face and proximity contacts
Source:vignettes/articles/data-contact.Rmd
data-contact.RmdWearable sensors record when two people (or animals, or devices) are
close to each other. Each record is an undirected contact between a pair
at a time stamp, usually at a resolution of 20 seconds, so these logs
are dense in time and repeat the same pairs many times. They suit models
of repeated contact, triadic closure and daily rhythms with
mode = "one". The SocioPatterns collection is released
under a Creative Commons Attribution-NonCommercial-ShareAlike licence,
which an MIT-licensed package cannot carry, so none of these datasets
ships with amorem.
The data catalogue lists every dataset with its licence. Figures and numbers on this page are aggregates computed from the files as published; each section links the source and the code that reads it.
SocioPatterns: high school contacts, diaries, friendship, Facebook 2013
Source: https://www.sociopatterns.org/datasets/high-school-contact-and-friendship-networks/ · Licence: CC BY-NC-SA · Status in amorem: non-commercial: not redistributable in amorem (MIT); obtain from the source.
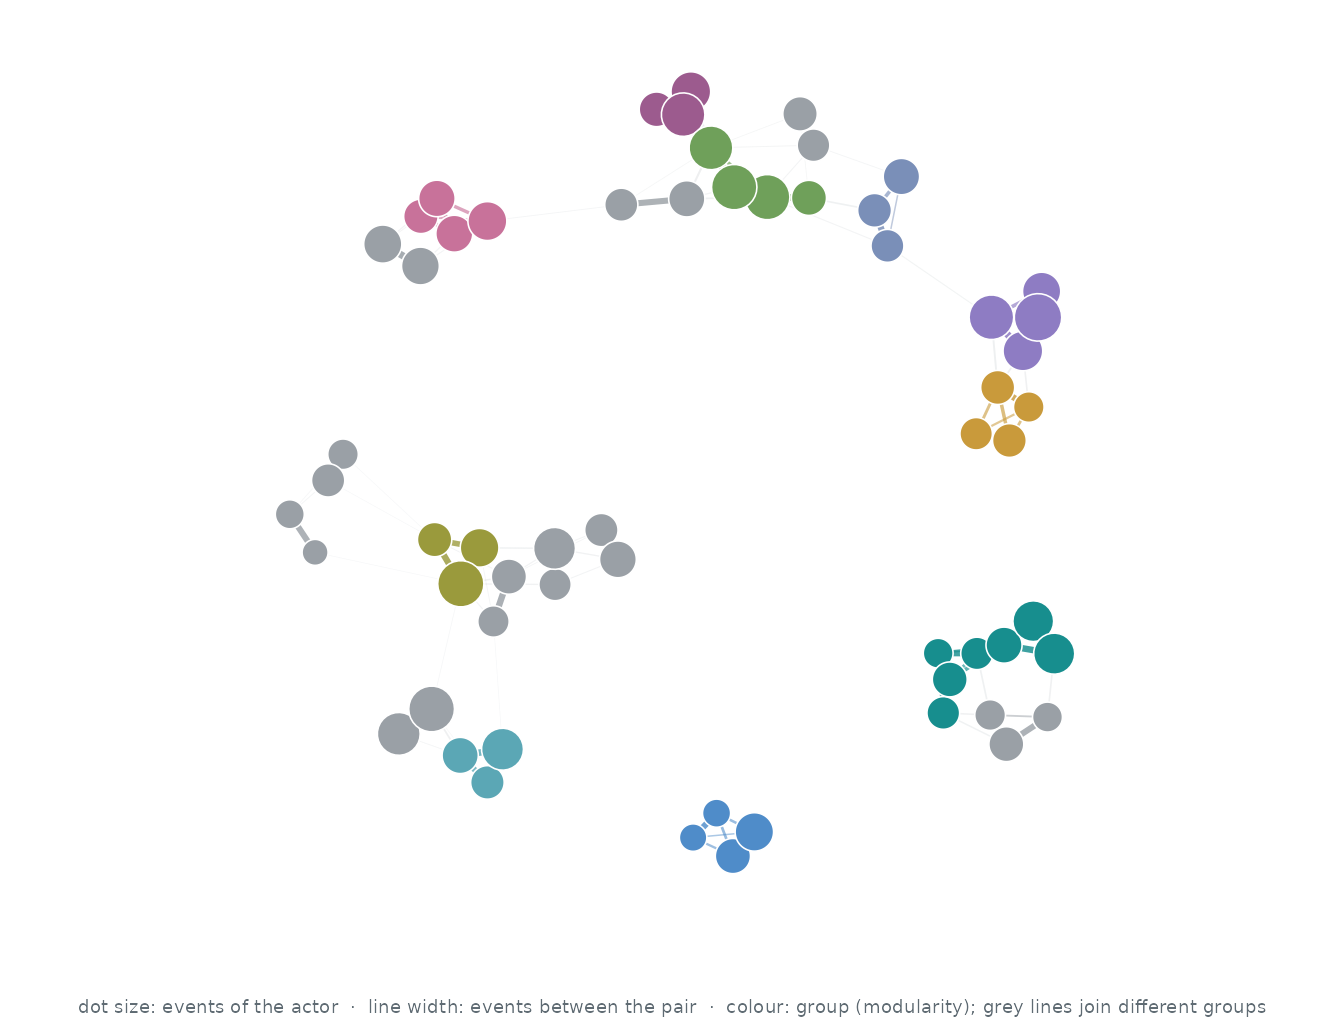
Who interacts with whom. The 60 actors of the busiest pairs, out of 327; events between two of them are 26.0% of all events. Each actor’s three strongest ties are drawn (112 of 261 pairs that ever interacted): wider, darker lines carry more events, larger dots are more active actors, and colours are groups found by modularity (Louvain).
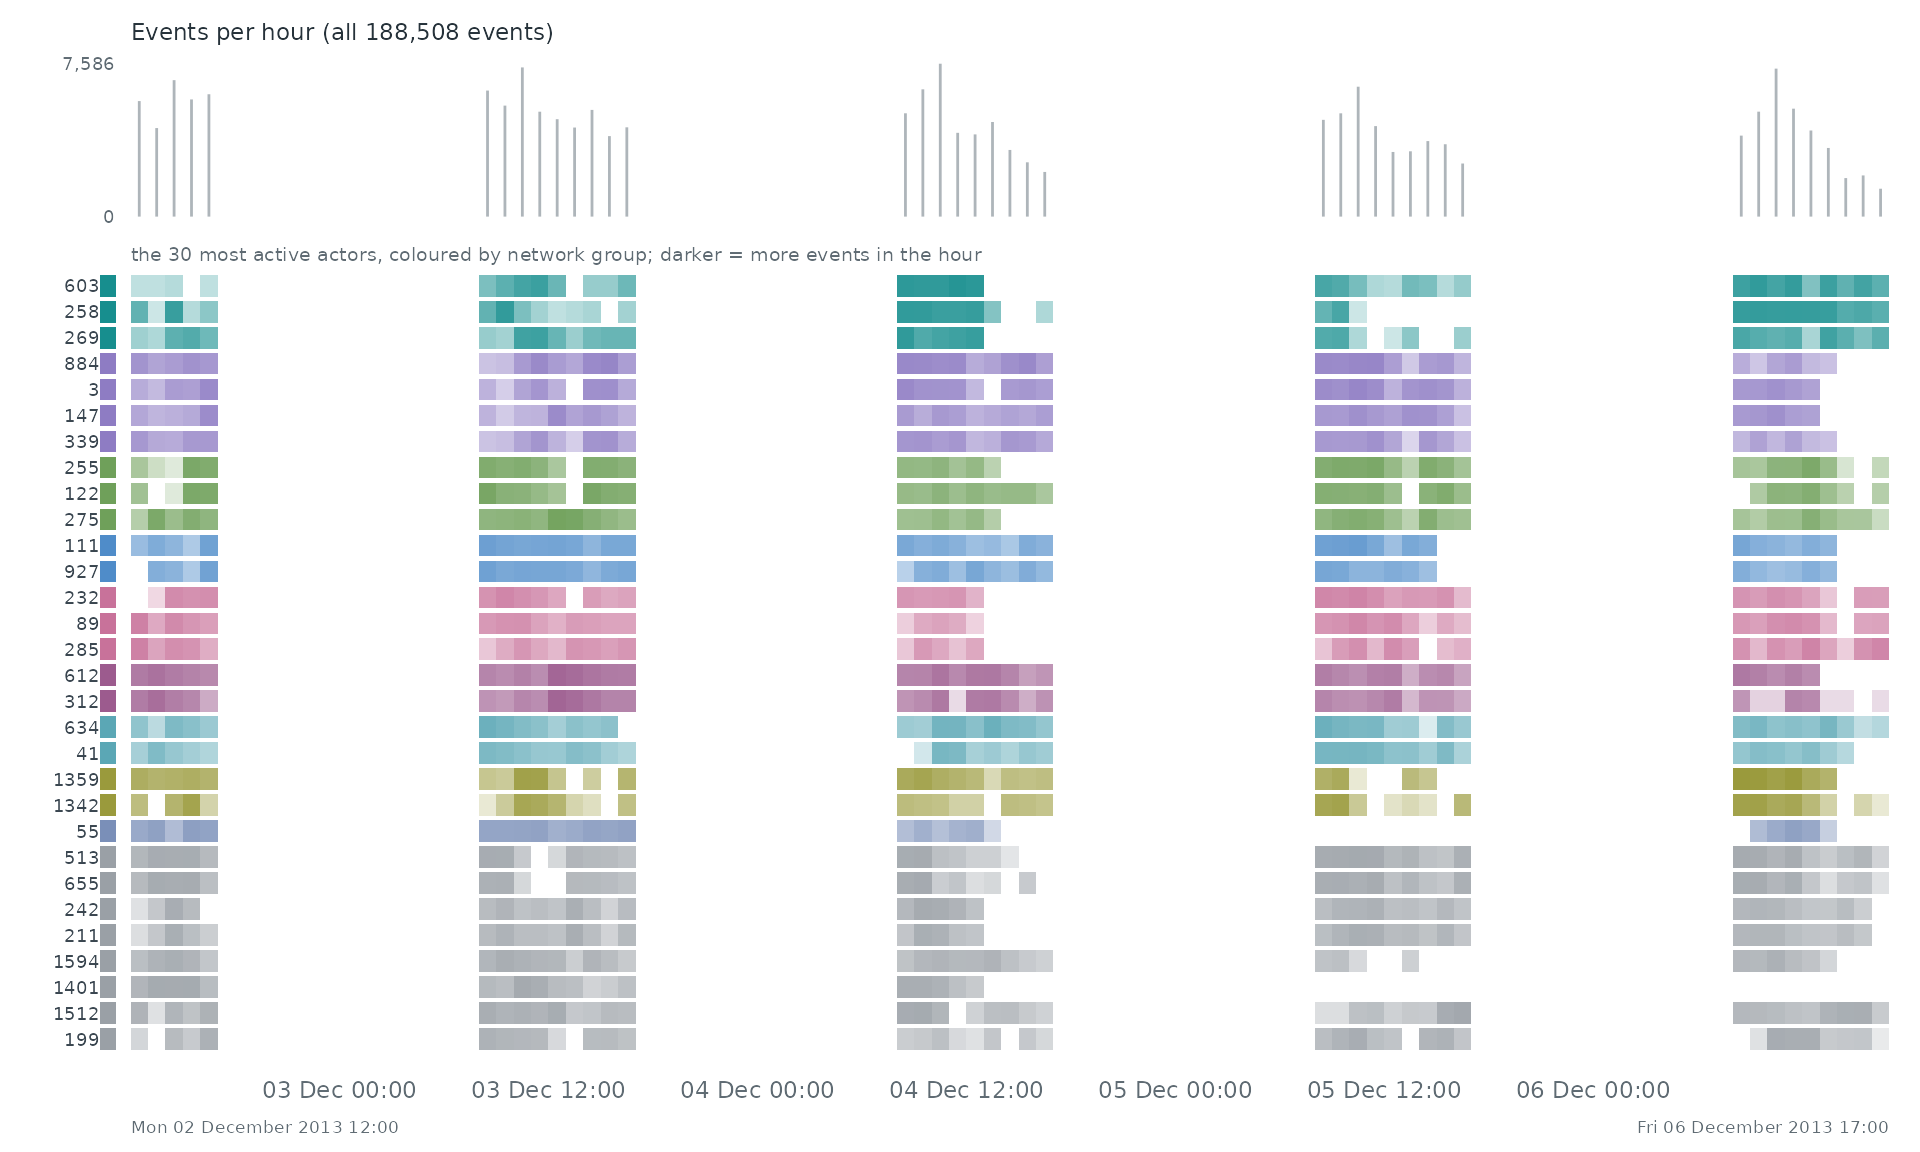
When. Each row is one of the 30 most active actors of the network, coloured by its group there; a cell is darker the more events (with anyone) the actor took part in during that stretch of time. The grey bars on top count all 188,508 events.
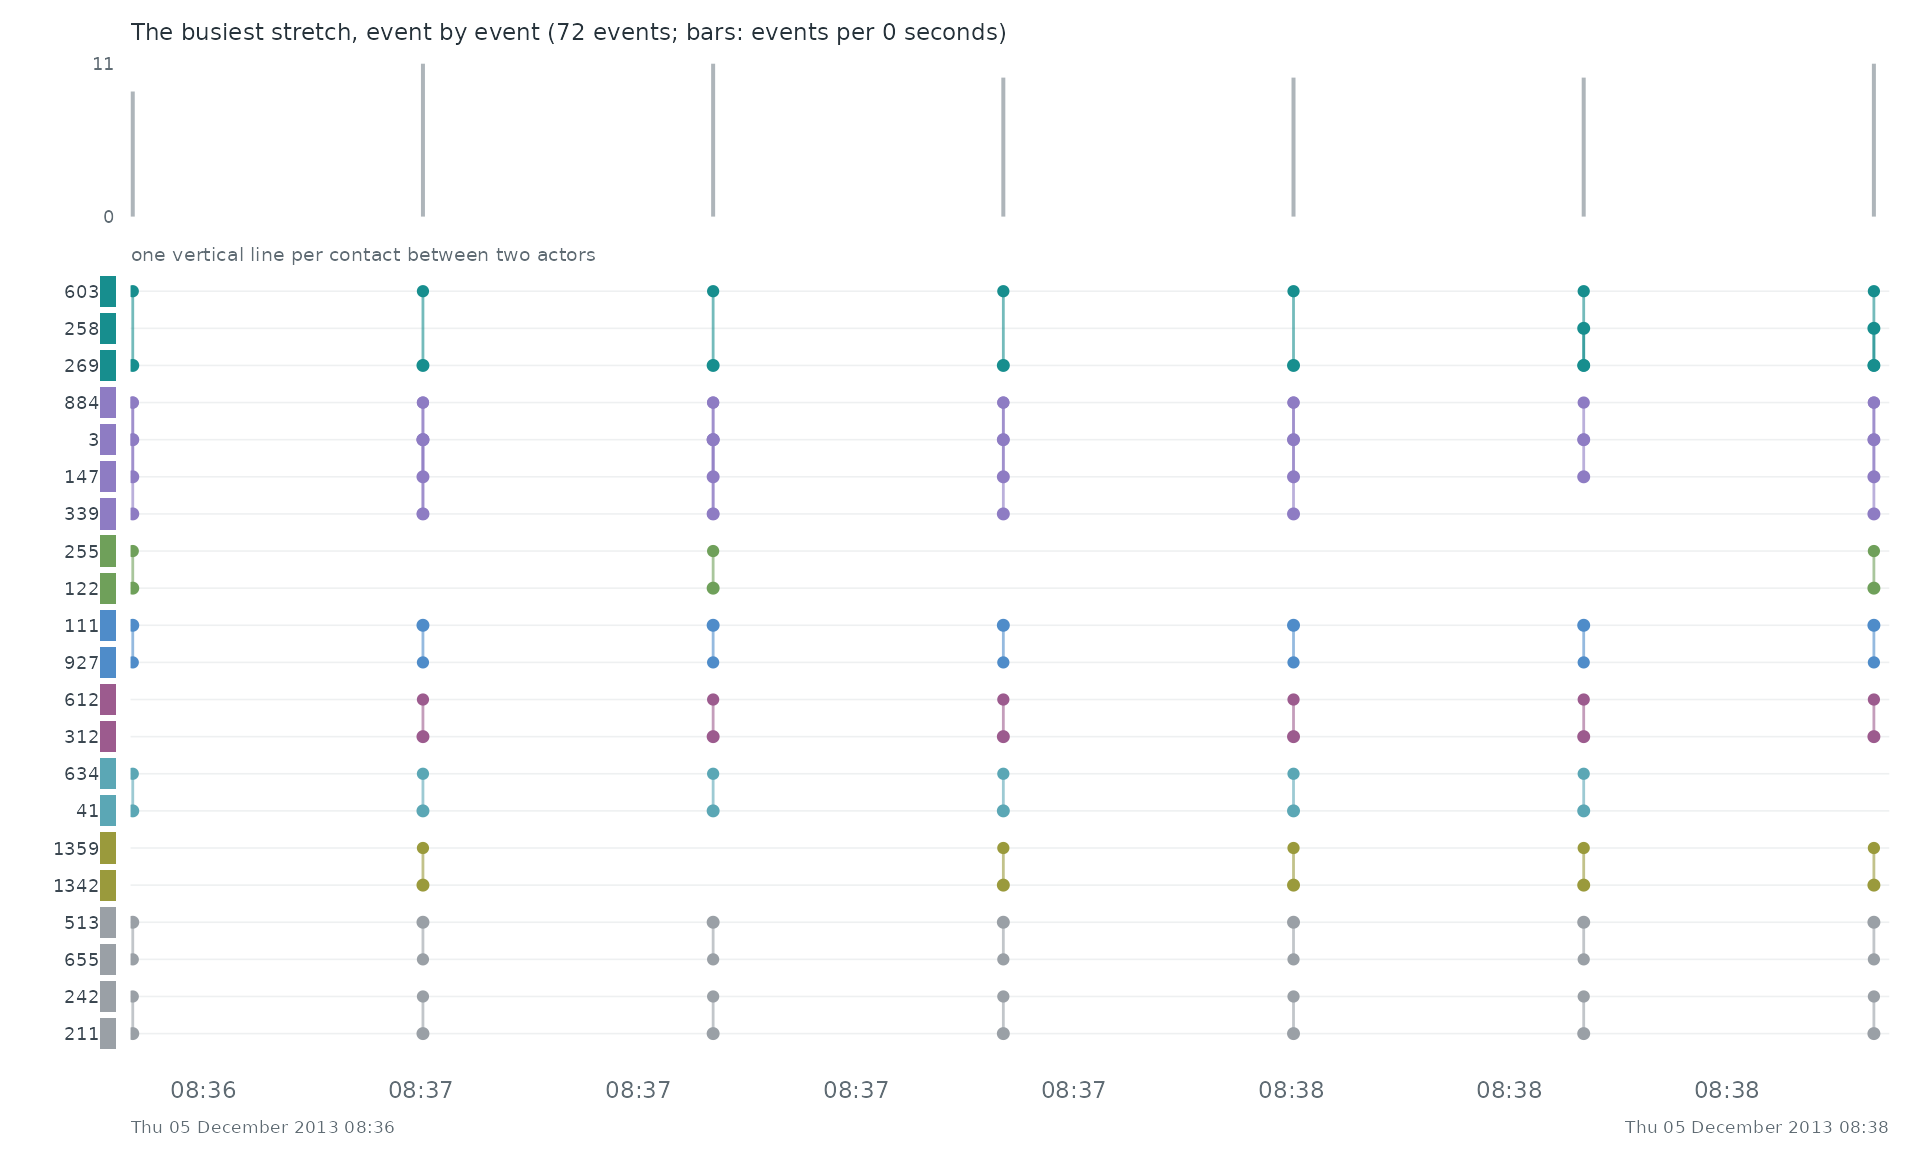
Event by event. The busiest stretch of the record, Thu 05 December 2013 08:36 to Thu 05 December 2013 08:38, event by event: each vertical line is one event between two of the actors above.
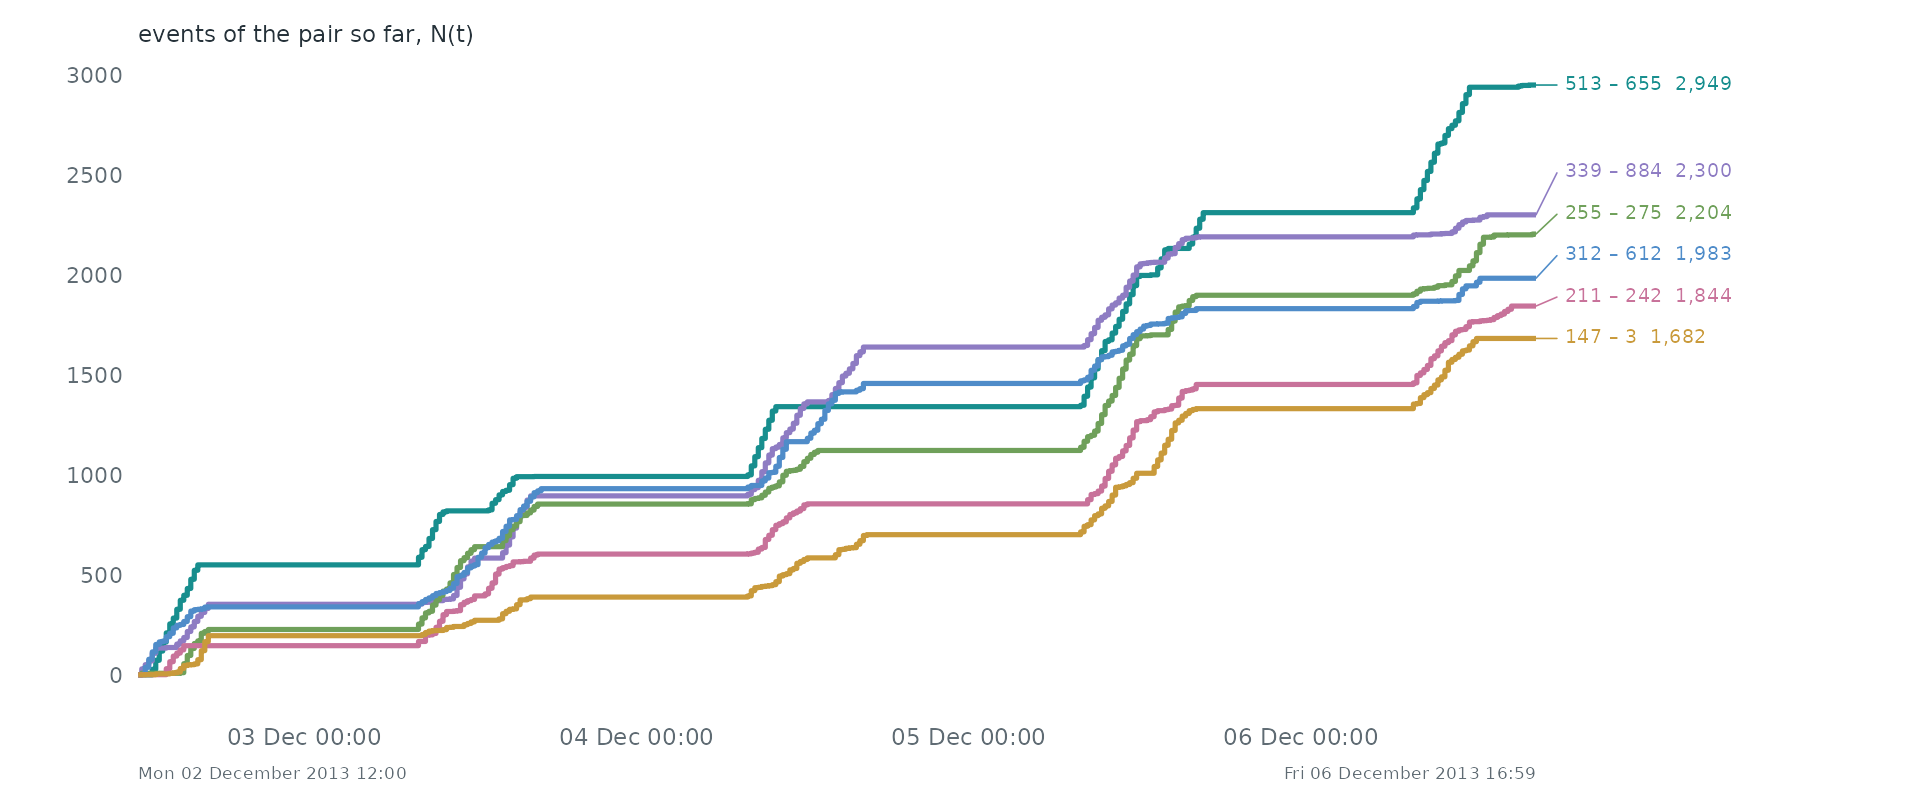
Pairs as counting processes. The counting process N(t) of the 6 busiest pairs: the number of events of the pair up to time t. Together they make 6.9% of all events. Steep stretches are bursts and flat ones silences.
Over time. Tue 03 Dec 2013, 08:00 to Tue 03 Dec 2013, 16:50 in windows of one 10 minutes (47,338 events in this span). Press play, or drag the bar to stop on a moment; the dark bar below the network marks the current window among all windows.
Statistical profile.
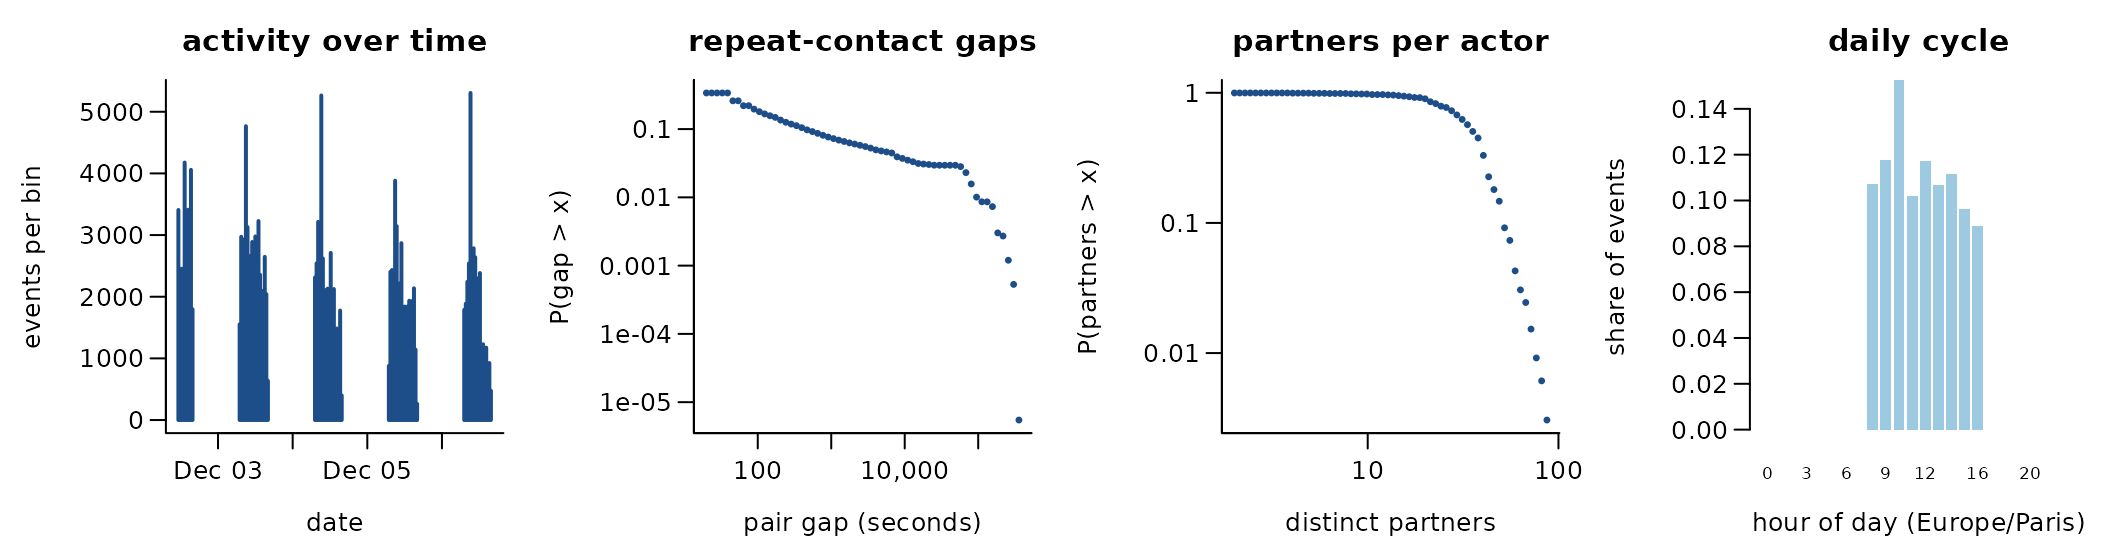
188,508 undirected contacts among 327 actors over 4.2 days (5,818 distinct pairs). 96.9% of events repeat an earlier pair; if every event chose a pair at random the share would be 72.5%. The burstiness coefficient of the gaps between successive events of the same pair is 0.72 (0 for a Poisson process, positive when events cluster in bursts); the most active tenth of the actors take part in 27.0% of events (Gini 0.41). 96.1% of events share their time stamp with an earlier one. Unix time; Lycee Thiers, Marseille, December 2013
Get the data
download.file("https://sociopatterns.org/assets/data/HighSchool2013_contactdiaries_network.csv.gz", "HighSchool2013_contactdiaries_network.csv.gz", mode = "wb")
download.file("https://sociopatterns.org/assets/data/HighSchool2013_facebook_known_pairs.csv.gz", "HighSchool2013_facebook_known_pairs.csv.gz", mode = "wb")
download.file("https://sociopatterns.org/assets/data/HighSchool2013_friendship_network.csv.gz", "HighSchool2013_friendship_network.csv.gz", mode = "wb")
download.file("https://sociopatterns.org/assets/data/HighSchool2013_metadata.txt", "HighSchool2013_metadata.txt", mode = "wb")
download.file("https://sociopatterns.org/assets/data/HighSchool2013_proximity_net.csv.gz", "HighSchool2013_proximity_net.csv.gz", mode = "wb")
A reader that turns these files into a
(sender, receiver, time) table is
readers[["sp-highschool-2013"]] in data-raw/catalogue/readers.R.
SocioPatterns: high school contacts 2011 and 2012 (Marseille)
Source: https://www.sociopatterns.org/datasets/high-school-contact-and-friendship-networks/ · Licence: CC BY-NC-SA · Status in amorem: non-commercial: not redistributable in amorem (MIT); obtain from the source.
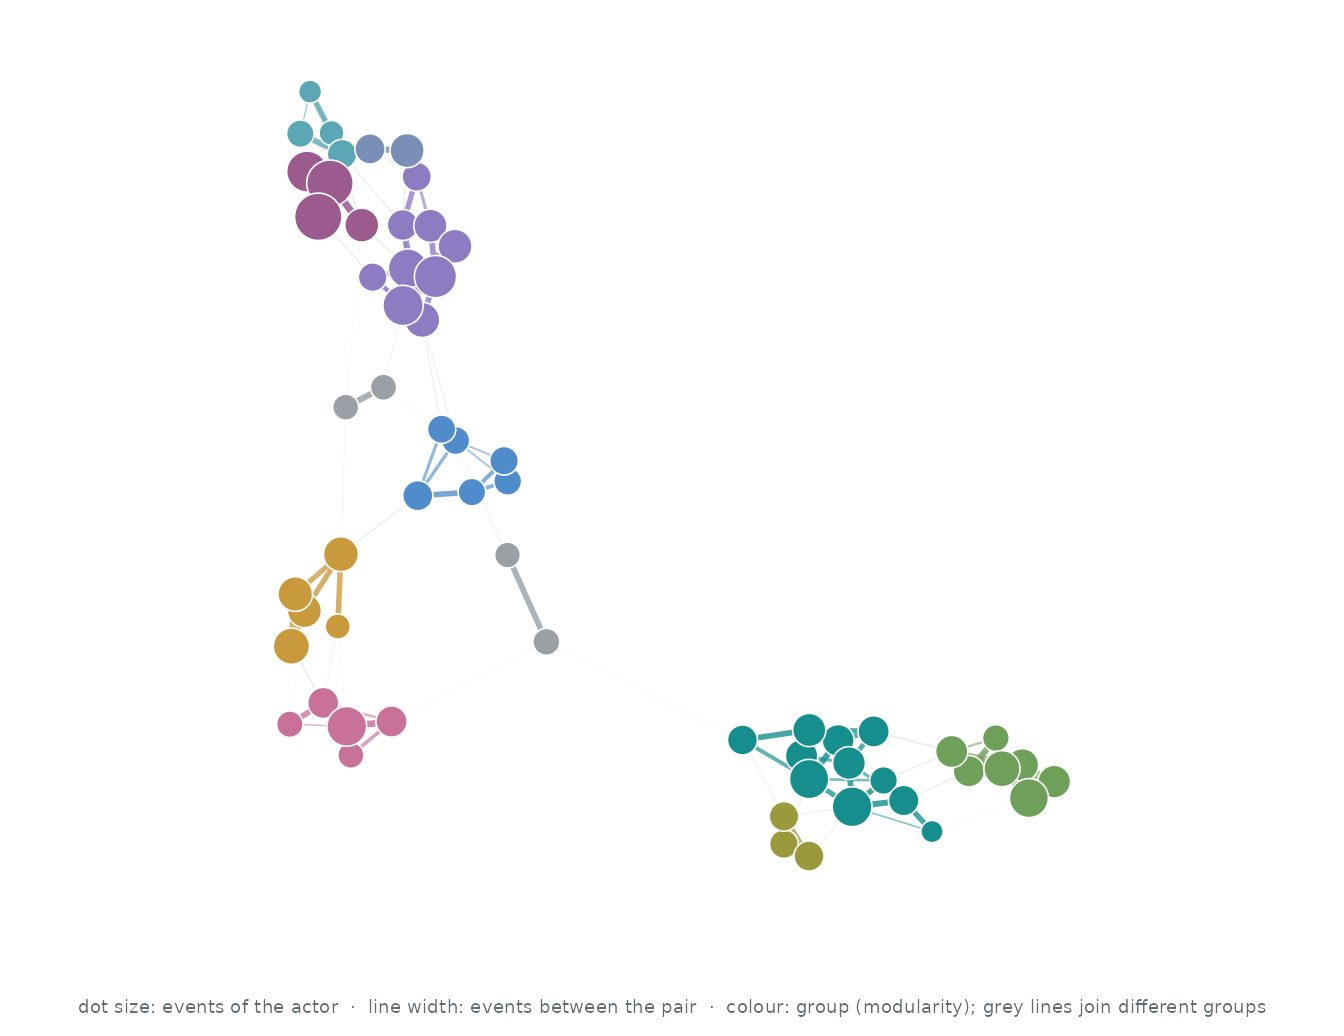
Who interacts with whom. The 60 actors of the busiest pairs, out of 180; events between two of them are 55.2% of all events. Each actor’s three strongest ties are drawn (121 of 451 pairs that ever interacted): wider, darker lines carry more events, larger dots are more active actors, and colours are groups found by modularity (Louvain).
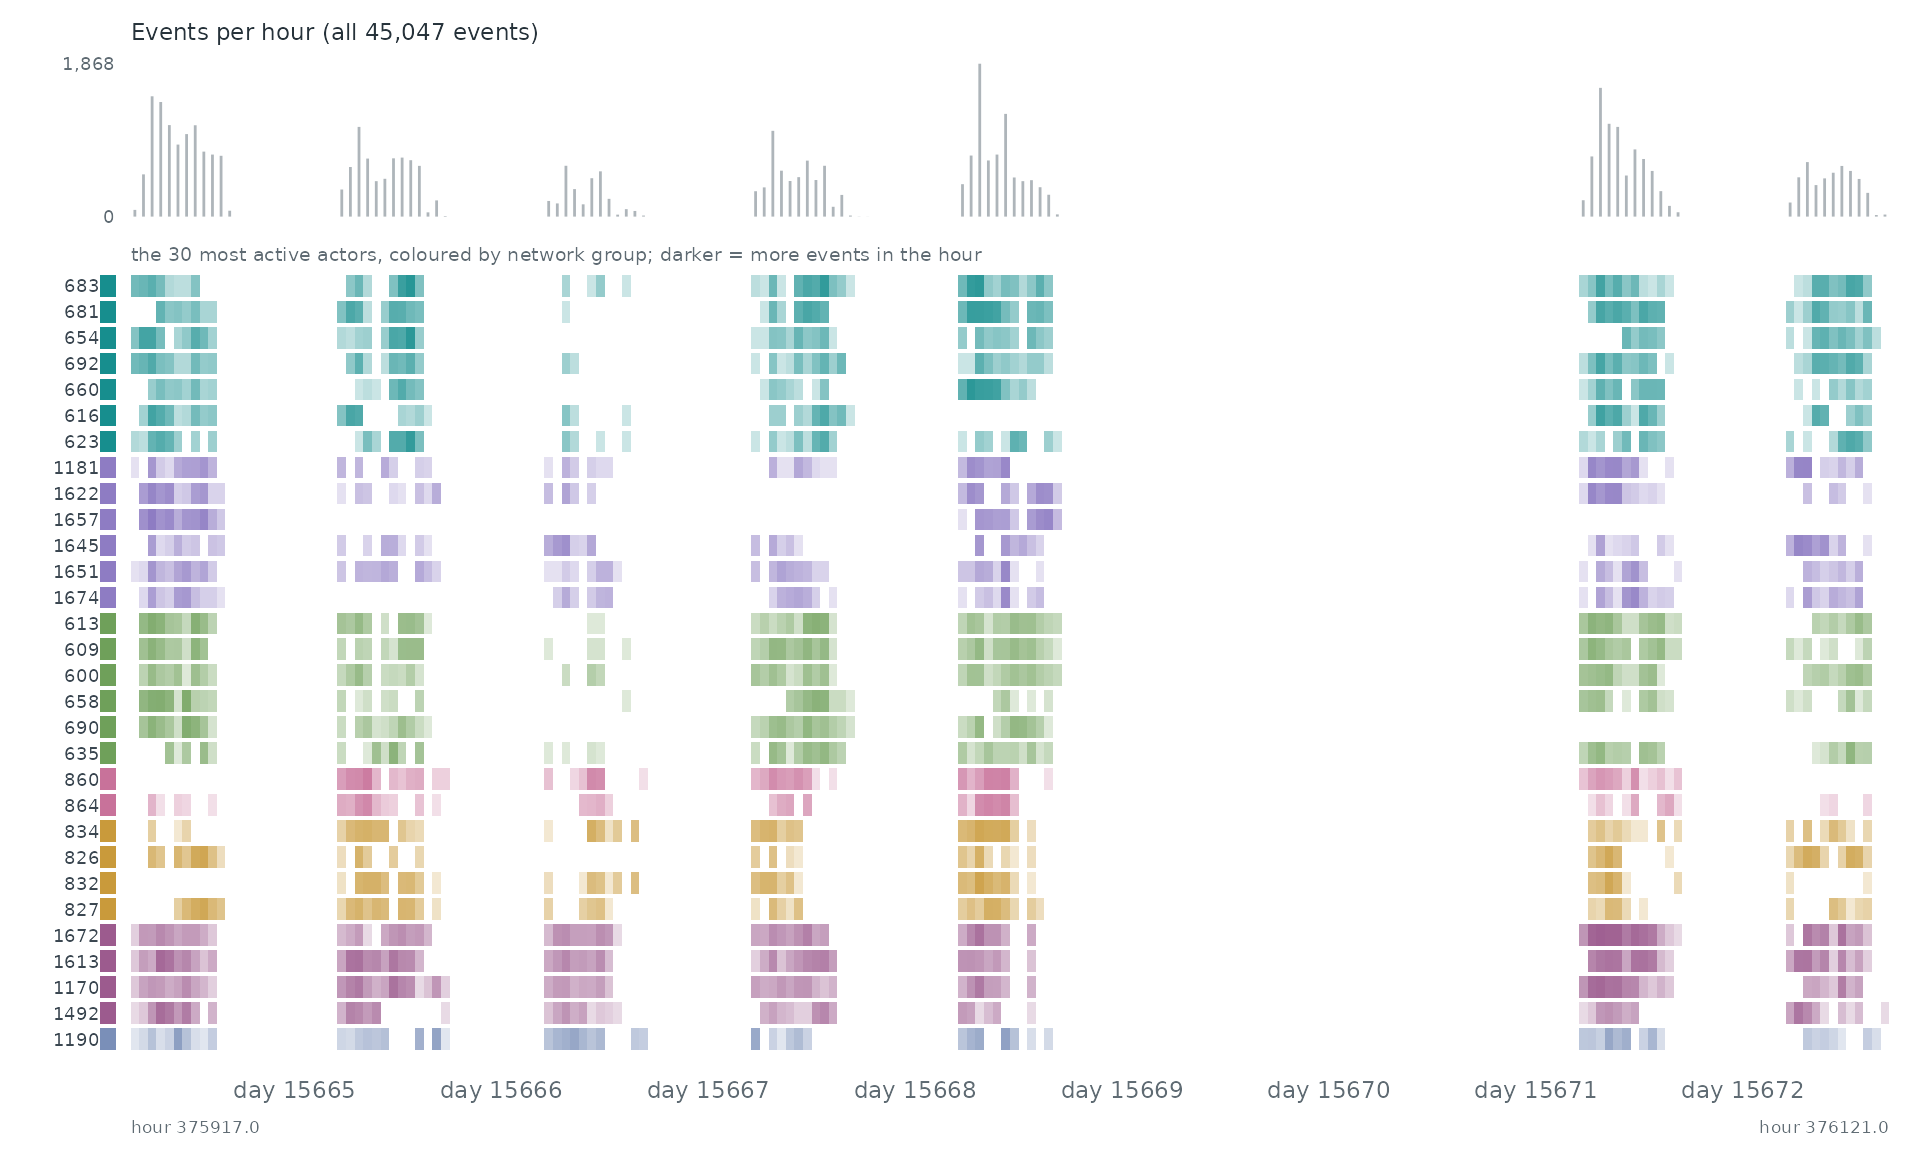
When. Each row is one of the 30 most active actors of the network, coloured by its group there; a cell is darker the more events (with anyone) the actor took part in during that stretch of time. The grey bars on top count all 45,047 events.
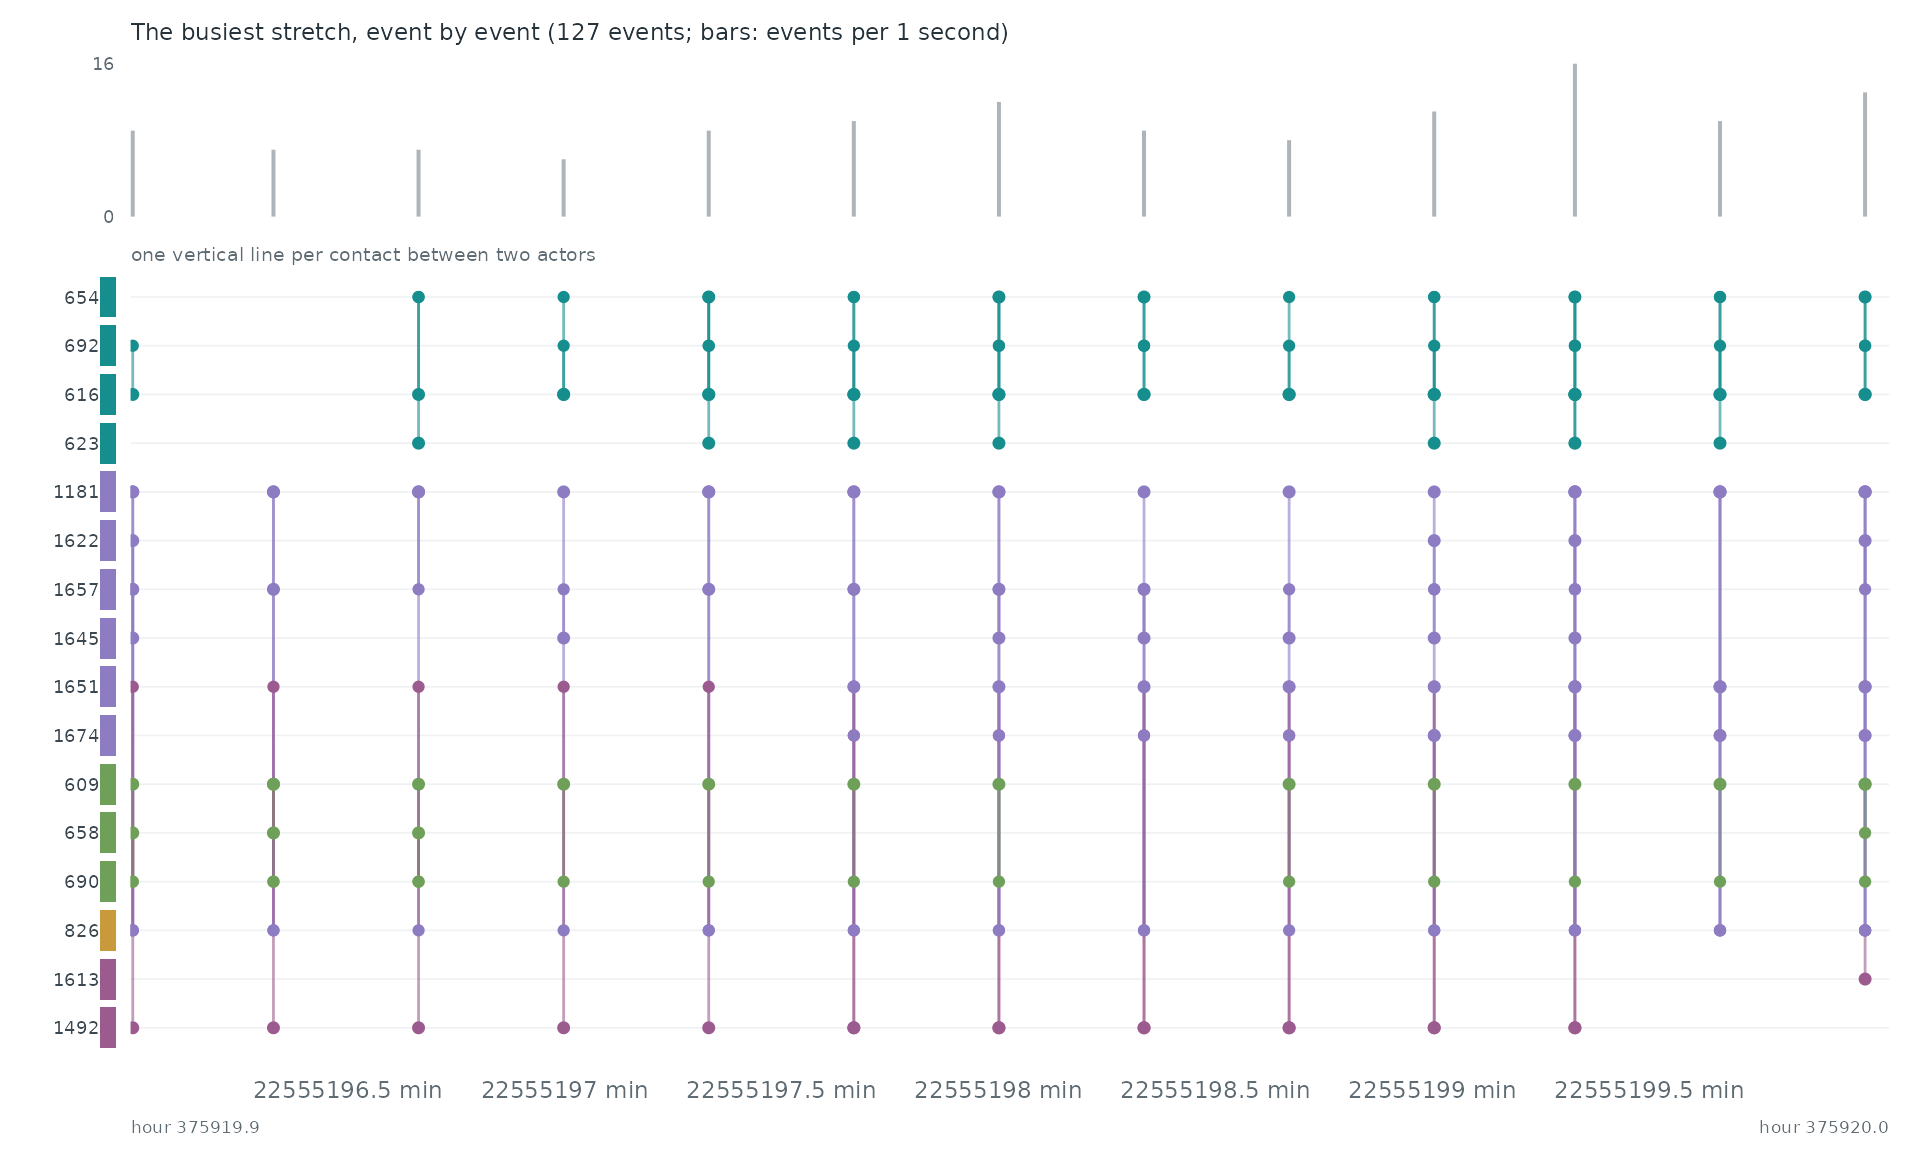
Event by event. The busiest stretch of the record, hour 375919.9 to hour 375920.0, event by event: each vertical line is one event between two of the actors above.
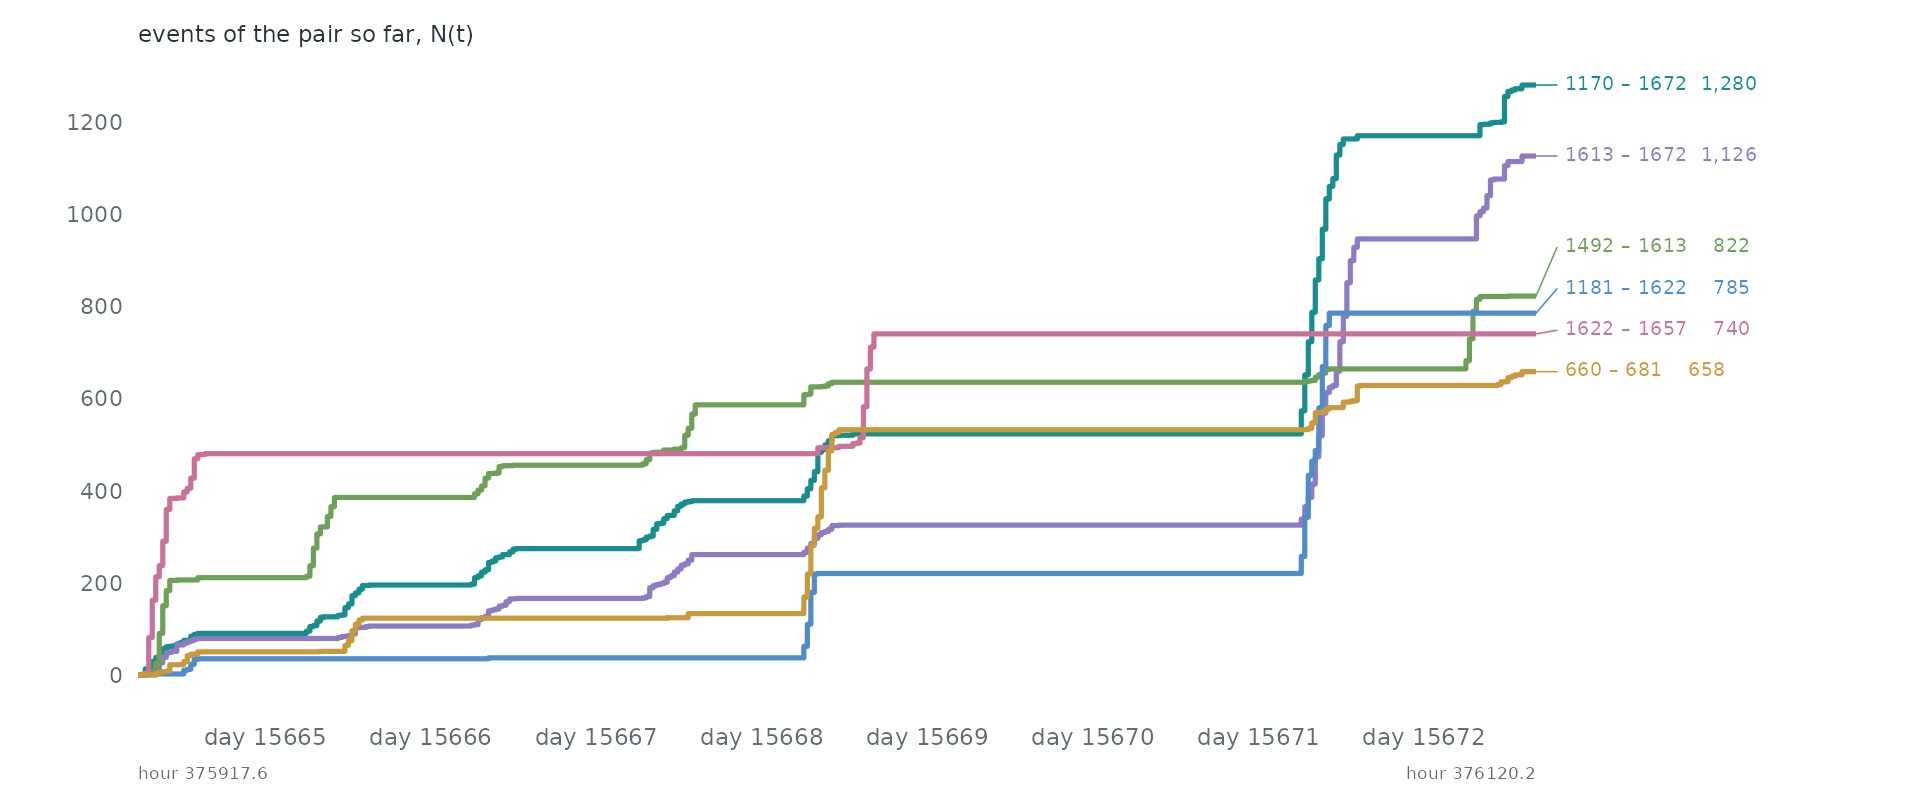
Pairs as counting processes. The counting process N(t) of the 6 busiest pairs: the number of events of the pair up to time t. Together they make 12.0% of all events. Steep stretches are bursts and flat ones silences.
Statistical profile.
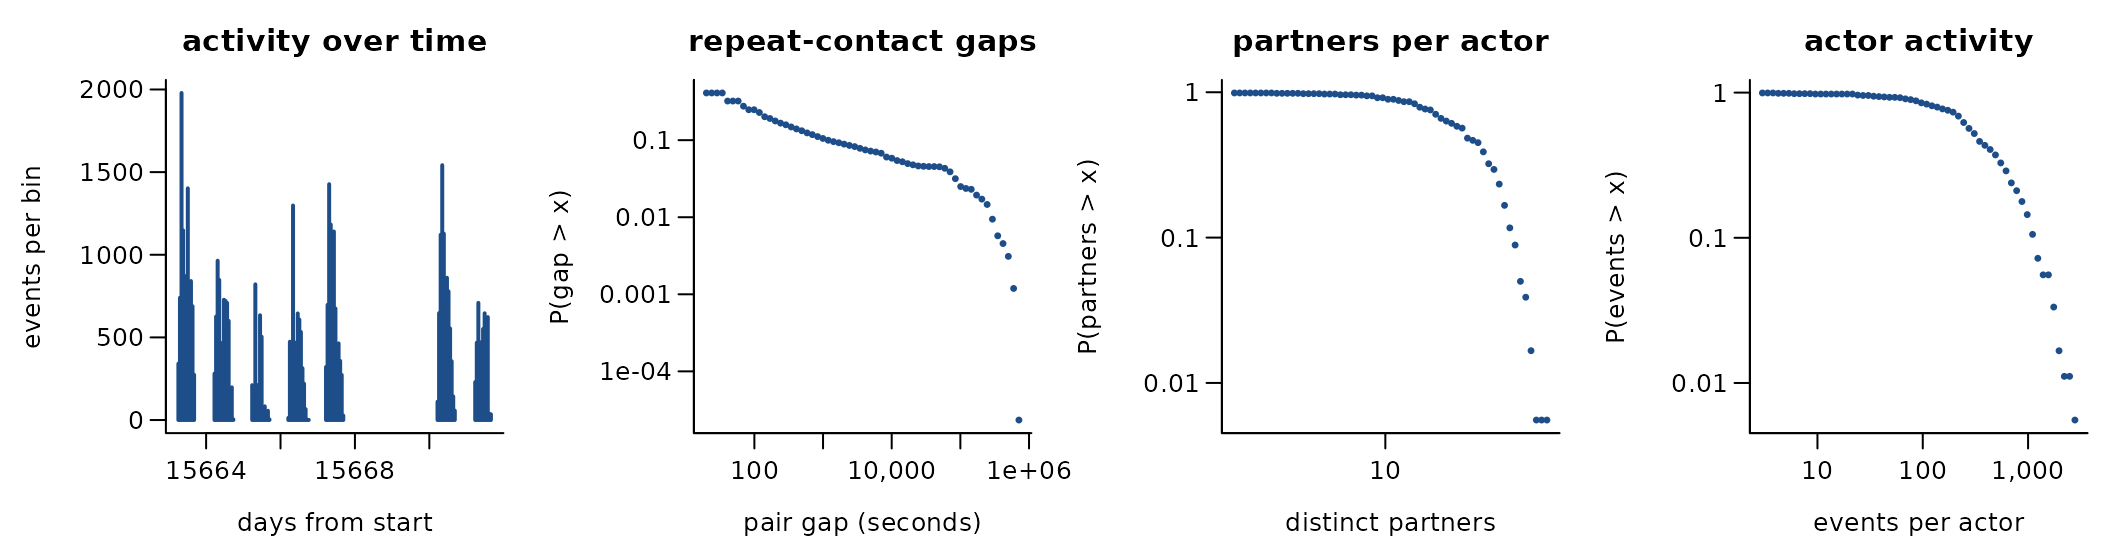
45,047 undirected contacts among 180 actors over 8.4 days (2,220 distinct pairs). 95.1% of events repeat an earlier pair; if every event chose a pair at random the share would be 66.4%. The burstiness coefficient of the gaps between successive events of the same pair is 0.69 (0 for a Poisson process, positive when events cluster in bursts); the most active tenth of the actors take part in 32.9% of events (Gini 0.49). 75.0% of events share their time stamp with an earlier one. 2012 file (180 students, 5 classes); the 2011 file is also in the folder
Get the data
download.file("https://sociopatterns.org/assets/data/highschool_2011.csv.gz", "highschool_2011.csv.gz", mode = "wb")
download.file("https://sociopatterns.org/assets/data/highschool_2011_metadata.txt", "highschool_2011_metadata.txt", mode = "wb")
download.file("https://sociopatterns.org/assets/data/highschool_2012.csv.gz", "highschool_2012.csv.gz", mode = "wb")
download.file("https://sociopatterns.org/assets/data/highschool_2012_metadata.txt", "highschool_2012_metadata.txt", mode = "wb")
A reader that turns these files into a
(sender, receiver, time) table is
readers[["sp-highschool-2011-2012"]] in data-raw/catalogue/readers.R.
SocioPatterns: primary school contacts (Lyon)
Source: https://www.sociopatterns.org/datasets/high-school-contact-and-friendship-networks/ · Licence: CC BY-NC-SA · Status in amorem: non-commercial: not redistributable in amorem (MIT); obtain from the source.
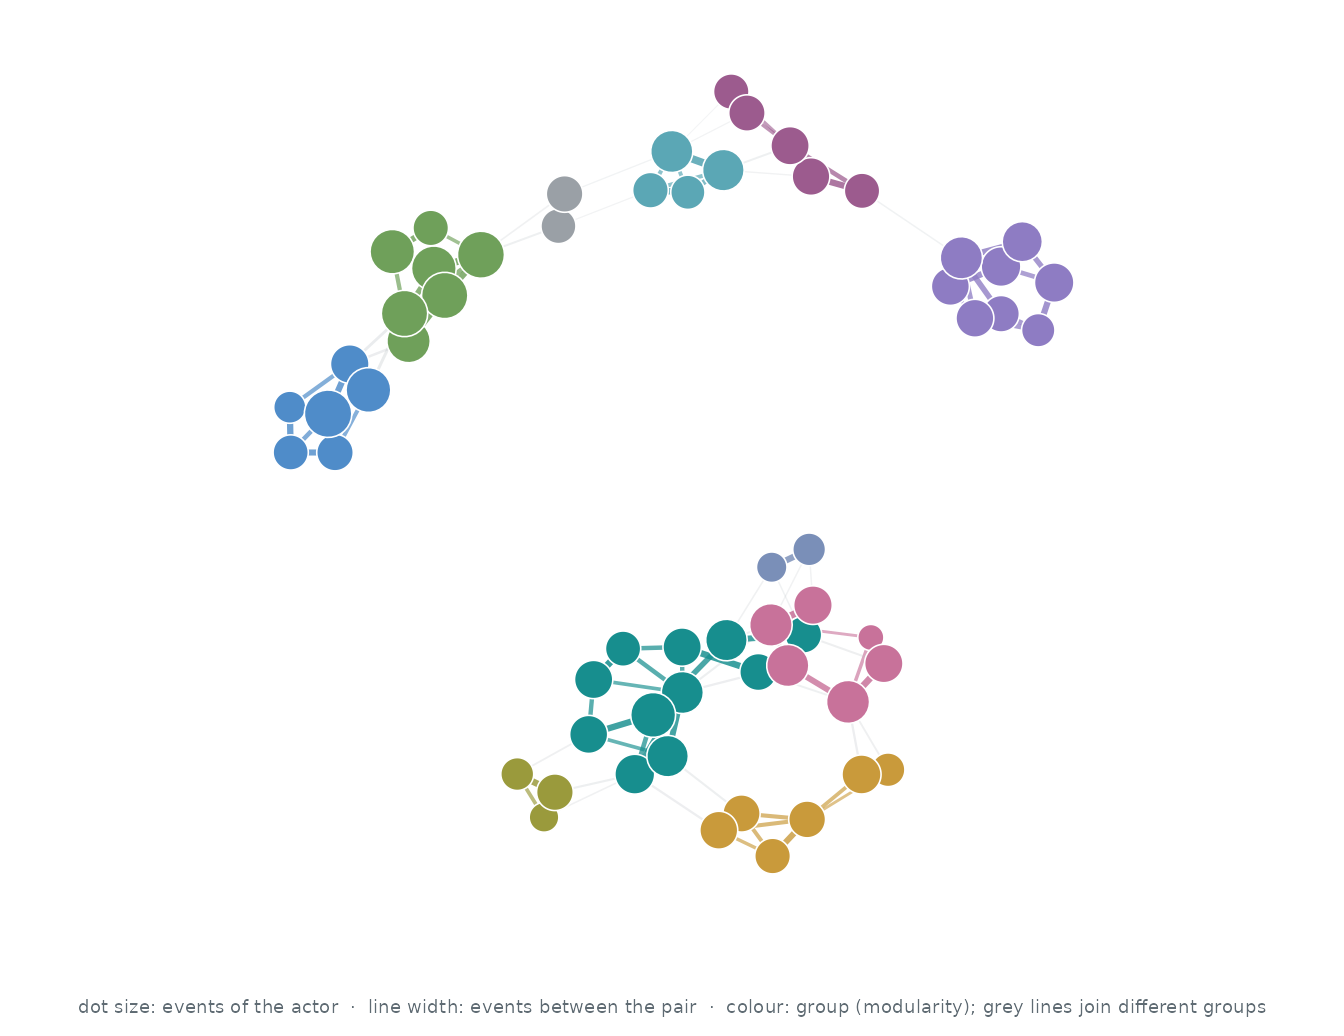
Who interacts with whom. The 60 actors of the busiest pairs, out of 242; events between two of them are 19.1% of all events. Each actor’s three strongest ties are drawn (118 of 766 pairs that ever interacted): wider, darker lines carry more events, larger dots are more active actors, and colours are groups found by modularity (Louvain).
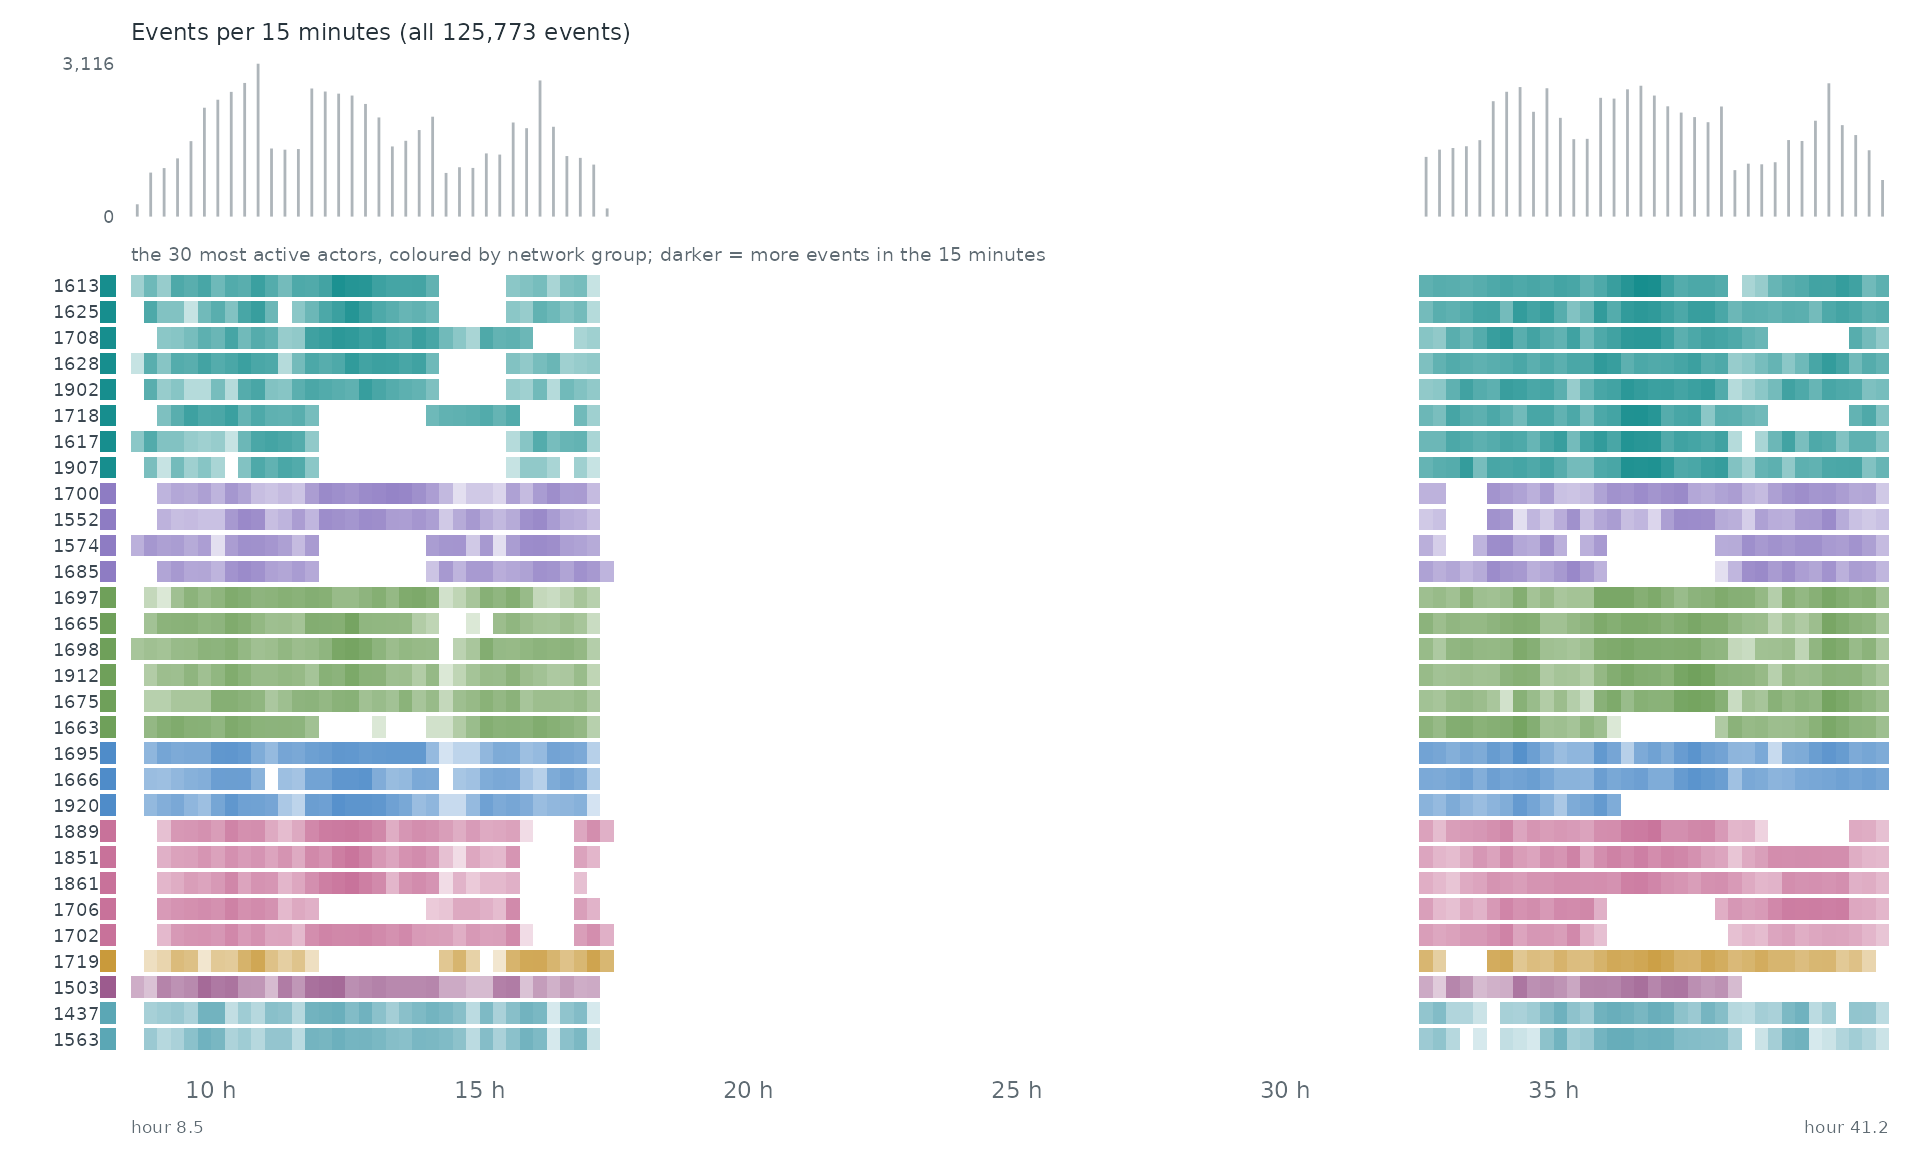
When. Each row is one of the 30 most active actors of the network, coloured by its group there; a cell is darker the more events (with anyone) the actor took part in during that stretch of time. The grey bars on top count all 125,773 events.
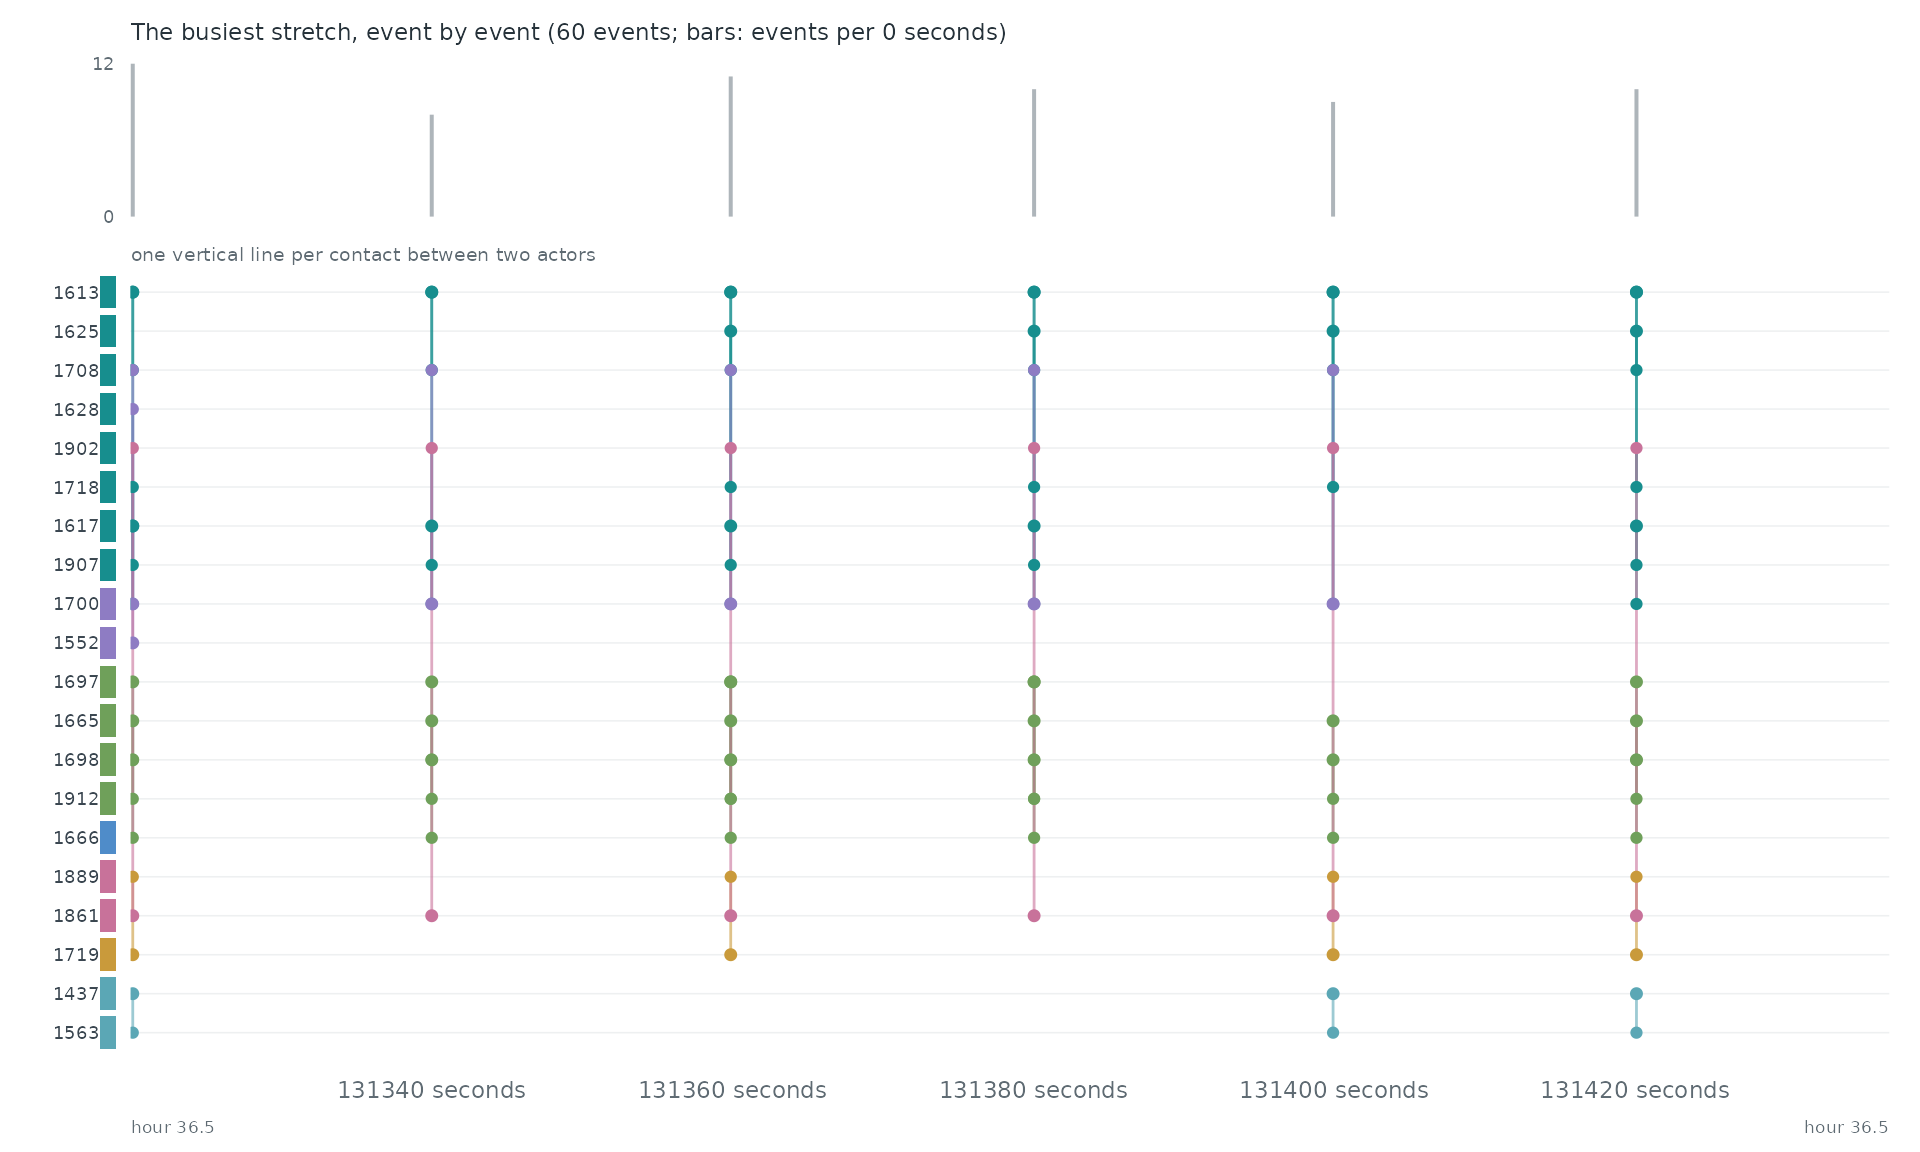
Event by event. The busiest stretch of the record, hour 36.5 to hour 36.5, event by event: each vertical line is one event between two of the actors above.
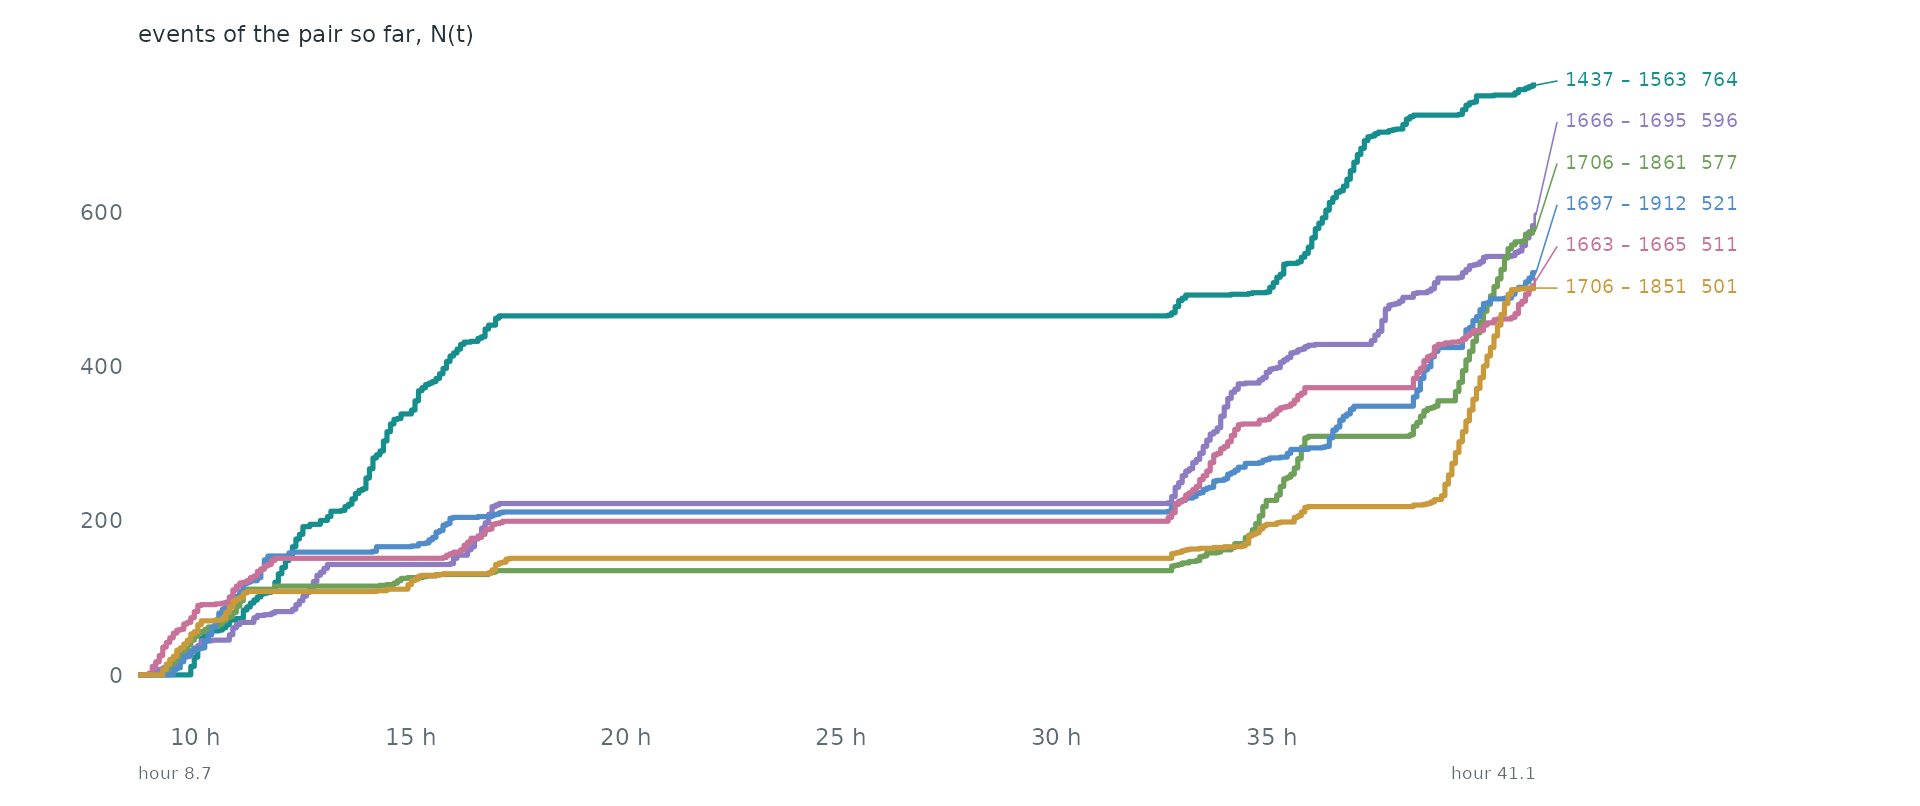
Pairs as counting processes. The counting process N(t) of the 6 busiest pairs: the number of events of the pair up to time t. Together they make 2.8% of all events. Steep stretches are bursts and flat ones silences.
Over time. day 2, 08:30 from start to day 2, 17:00 from start in windows of one 10 minutes (65,150 events in this span). Press play, or drag the bar to stop on a moment; the dark bar below the network marks the current window among all windows.
Statistical profile.
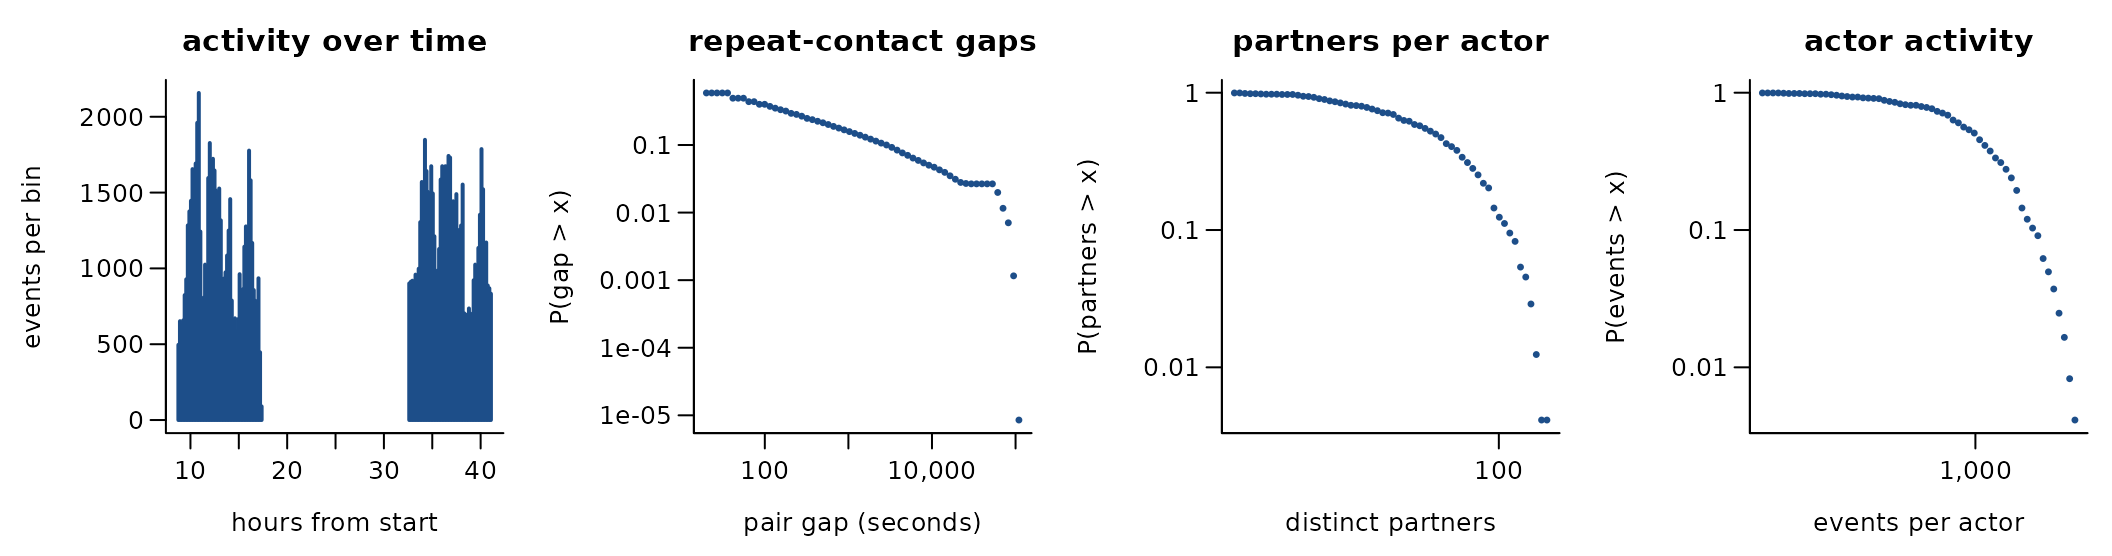
125,773 undirected contacts among 242 actors over 1.4 days (8,317 distinct pairs). 93.4% of events repeat an earlier pair; if every event chose a pair at random the share would be 77.1%. The burstiness coefficient of the gaps between successive events of the same pair is 0.63 (0 for a Poisson process, positive when events cluster in bursts); the most active tenth of the actors take part in 20.4% of events (Gini 0.28). 97.5% of events share their time stamp with an earlier one. two school days, Lyon, October 2009
Get the data
download.file("https://sociopatterns.org/assets/data/primaryschool.csv.gz", "primaryschool.csv.gz", mode = "wb")
download.file("https://sociopatterns.org/assets/data/primaryschool_metadata.txt", "primaryschool_metadata.txt", mode = "wb")
A reader that turns these files into a
(sender, receiver, time) table is
readers[["sp-primaryschool"]] in data-raw/catalogue/readers.R.
SocioPatterns: hospital ward contacts (Lyon)
Source: https://www.sociopatterns.org/datasets/high-school-contact-and-friendship-networks/ · Licence: CC BY-NC-SA · Status in amorem: non-commercial: not redistributable in amorem (MIT); obtain from the source.
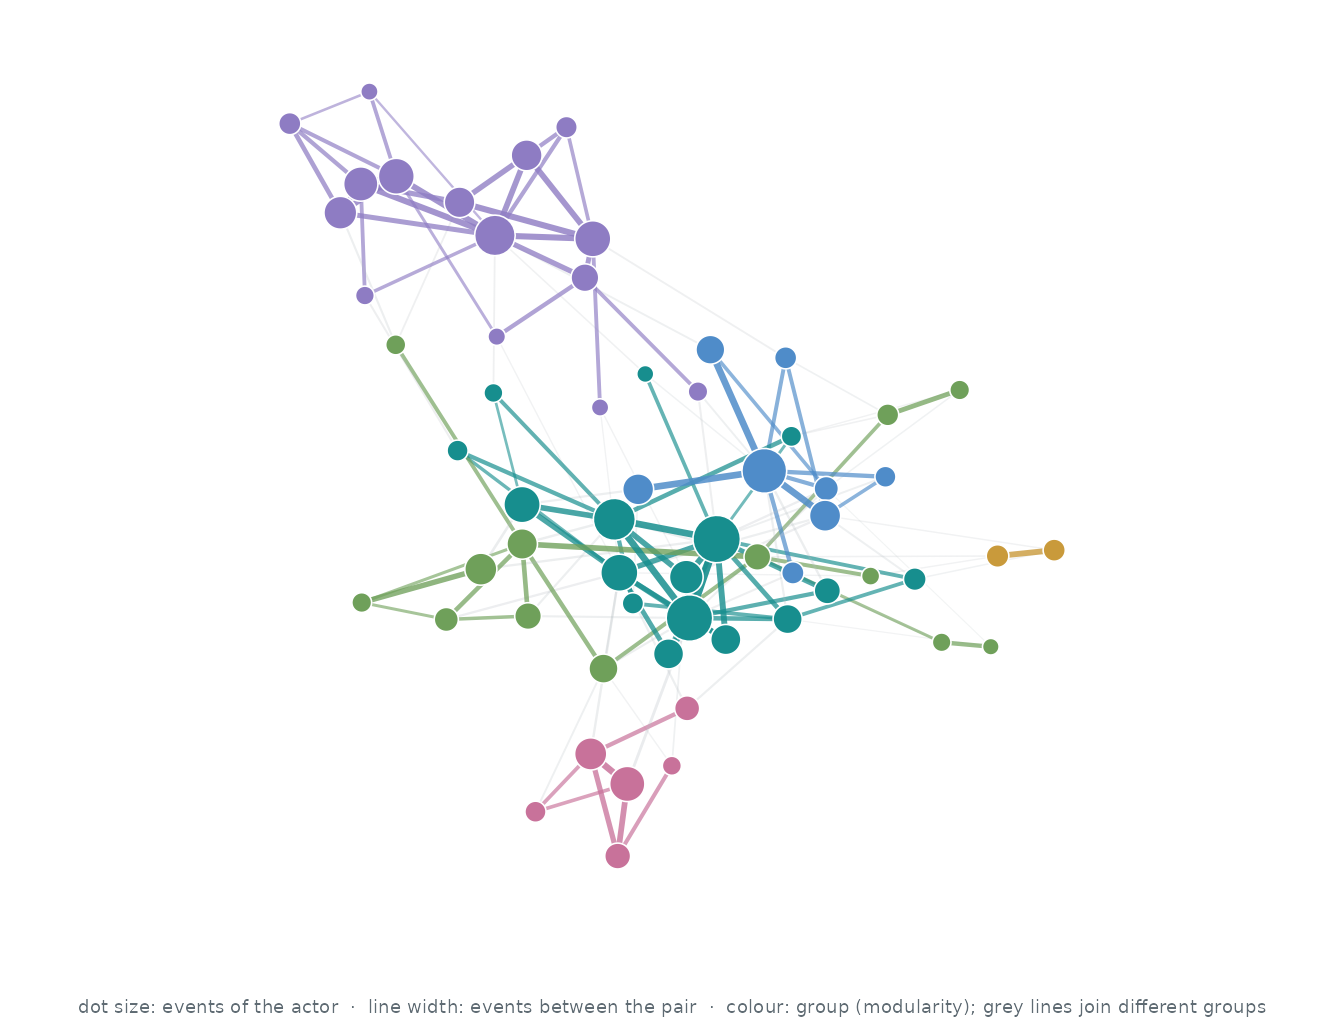
Who interacts with whom. The 60 actors of the busiest pairs, out of 75; events between two of them are 96.0% of all events. Each actor’s three strongest ties are drawn (147 of 931 pairs that ever interacted): wider, darker lines carry more events, larger dots are more active actors, and colours are groups found by modularity (Louvain).
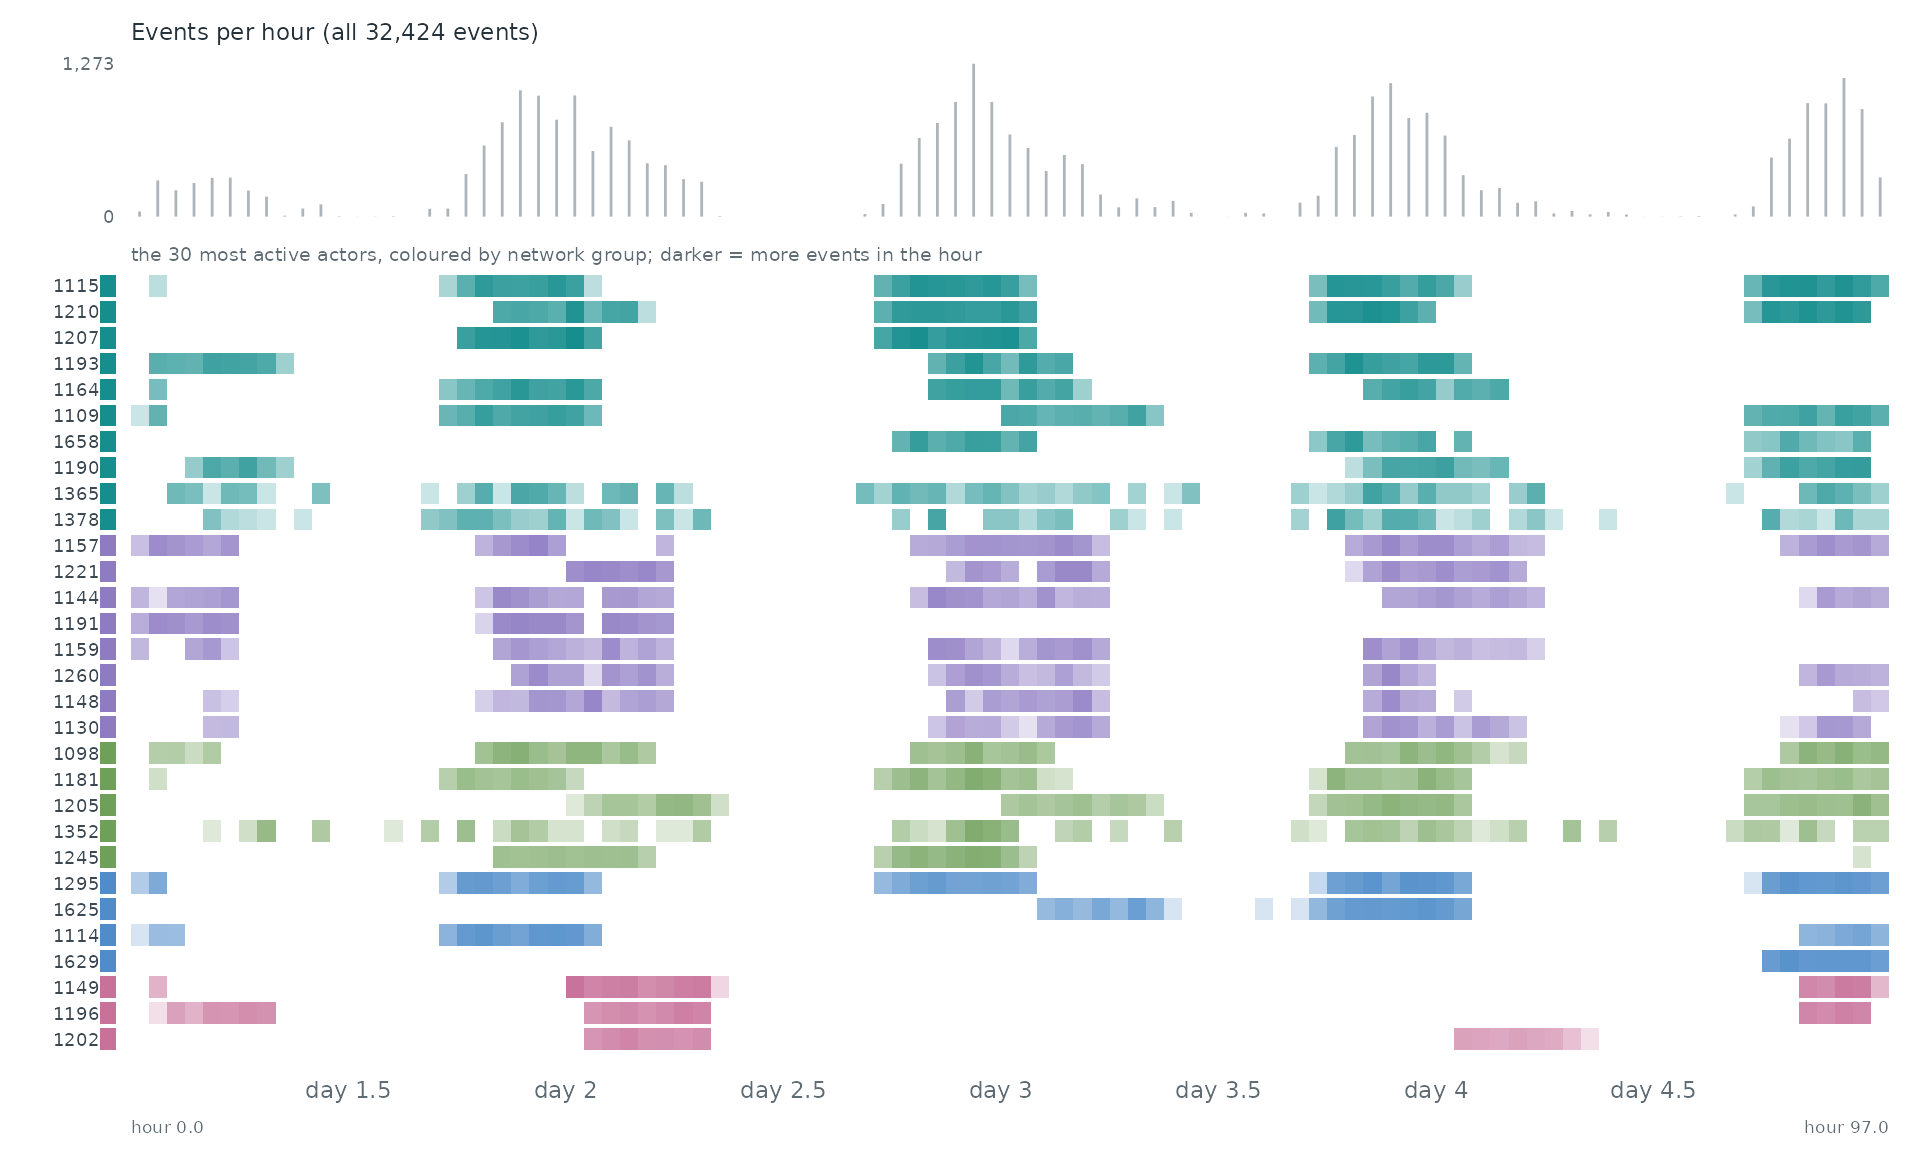
When. Each row is one of the 30 most active actors of the network, coloured by its group there; a cell is darker the more events (with anyone) the actor took part in during that stretch of time. The grey bars on top count all 32,424 events.
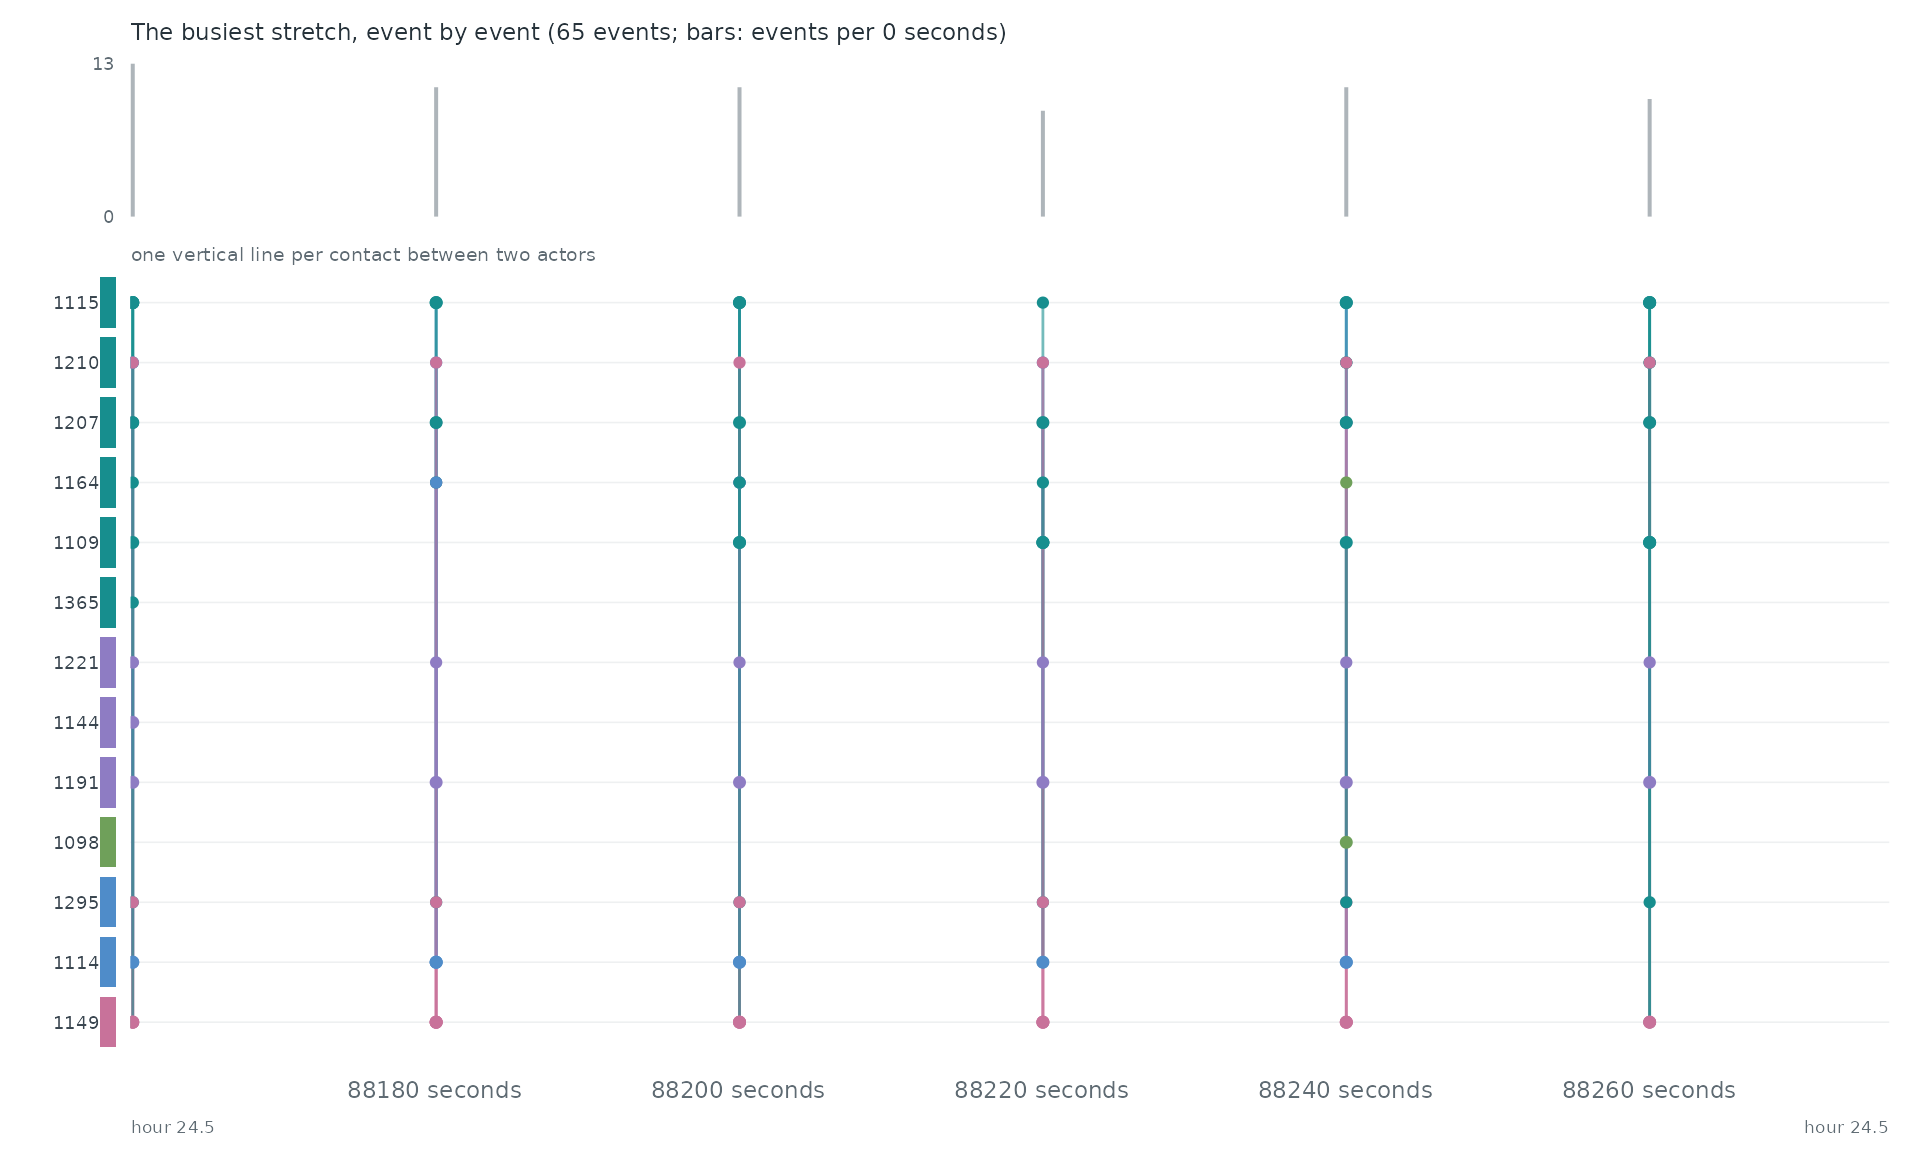
Event by event. The busiest stretch of the record, hour 24.5 to hour 24.5, event by event: each vertical line is one event between two of the actors above.
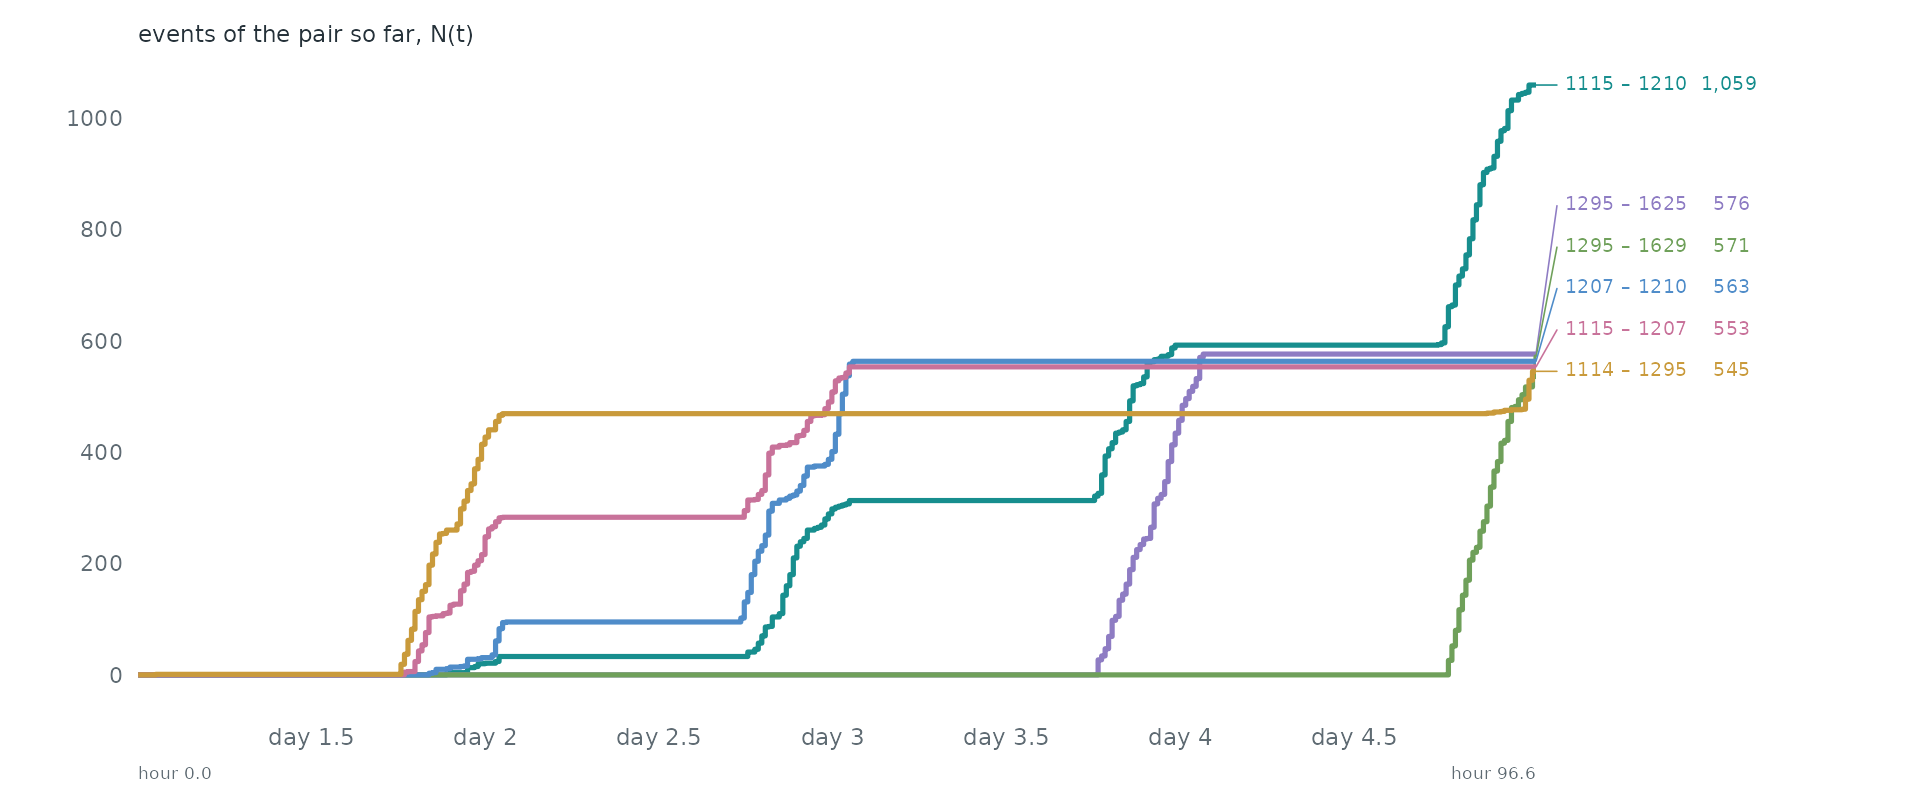
Pairs as counting processes. The counting process N(t) of the 6 busiest pairs: the number of events of the pair up to time t. Together they make 11.9% of all events. Steep stretches are bursts and flat ones silences.
Over time. day 2, 00:00 from start to day 2, 23:45 from start in windows of one 15 minutes (9,602 events in this span). Press play, or drag the bar to stop on a moment; the dark bar below the network marks the current window among all windows.
Statistical profile.
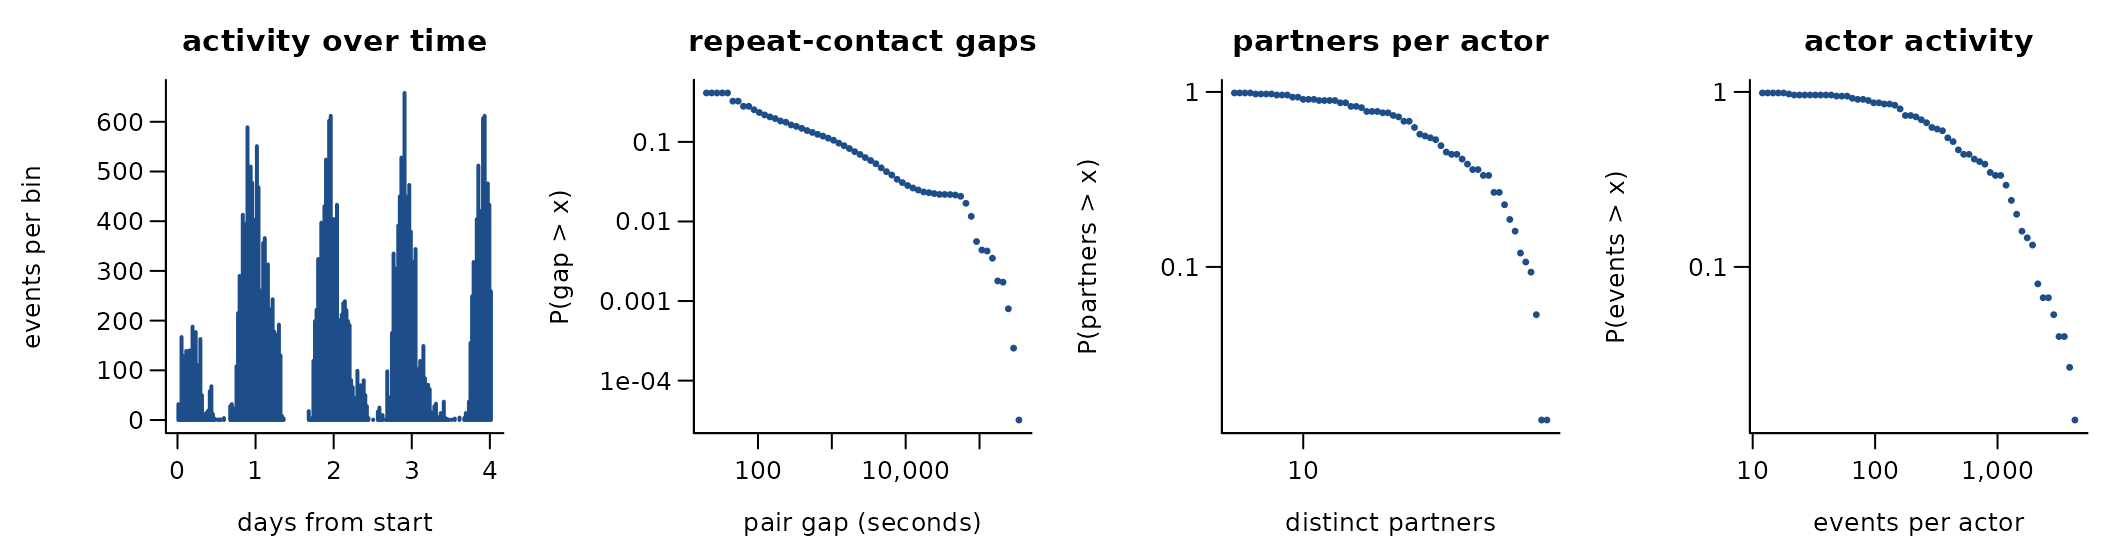
32,424 undirected contacts among 75 actors over 4.0 days (1,139 distinct pairs). 96.5% of events repeat an earlier pair; if every event chose a pair at random the share would be 91.4%. The burstiness coefficient of the gaps between successive events of the same pair is 0.73 (0 for a Poisson process, positive when events cluster in bursts); the most active tenth of the actors take part in 37.7% of events (Gini 0.55). 70.8% of events share their time stamp with an earlier one. roles: ADM, MED, NUR, PAT
Get the data
download.file("https://sociopatterns.org/assets/data/hospital_lyon_contacts.dat.gz", "hospital_lyon_contacts.dat.gz", mode = "wb")A reader that turns these files into a
(sender, receiver, time) table is
readers[["sp-hospital-lyon"]] in data-raw/catalogue/readers.R.
SocioPatterns: workplace contacts 2013 (InVS)
Source: https://www.sociopatterns.org/datasets/high-school-contact-and-friendship-networks/ · Licence: CC BY-NC-SA · Status in amorem: non-commercial: not redistributable in amorem (MIT); obtain from the source.
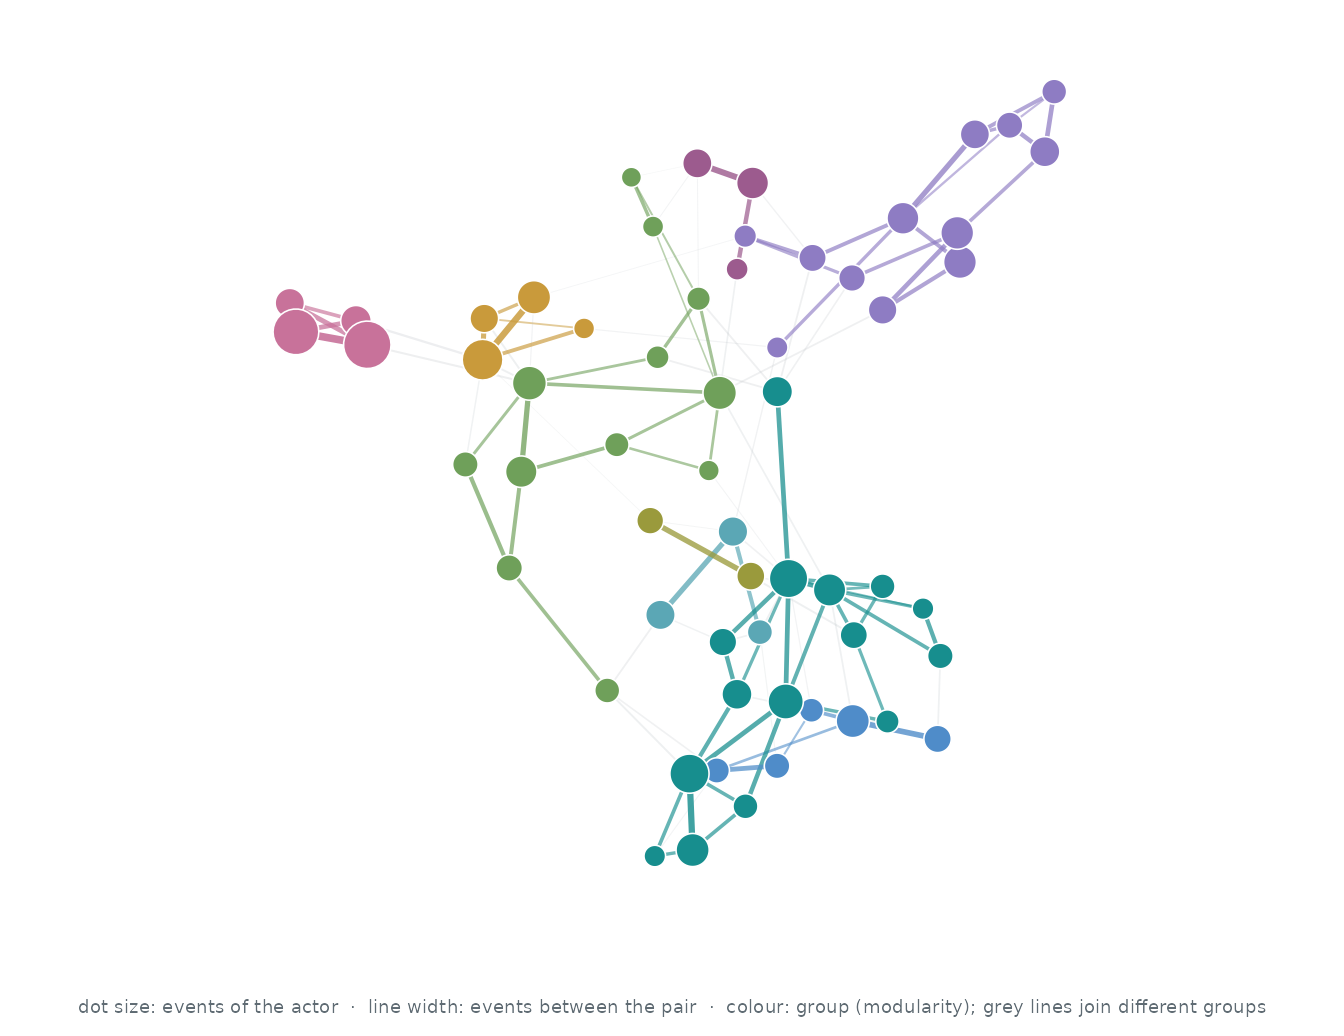
Who interacts with whom. The 60 actors of the busiest pairs, out of 92; events between two of them are 81.1% of all events. Each actor’s three strongest ties are drawn (119 of 416 pairs that ever interacted): wider, darker lines carry more events, larger dots are more active actors, and colours are groups found by modularity (Louvain).
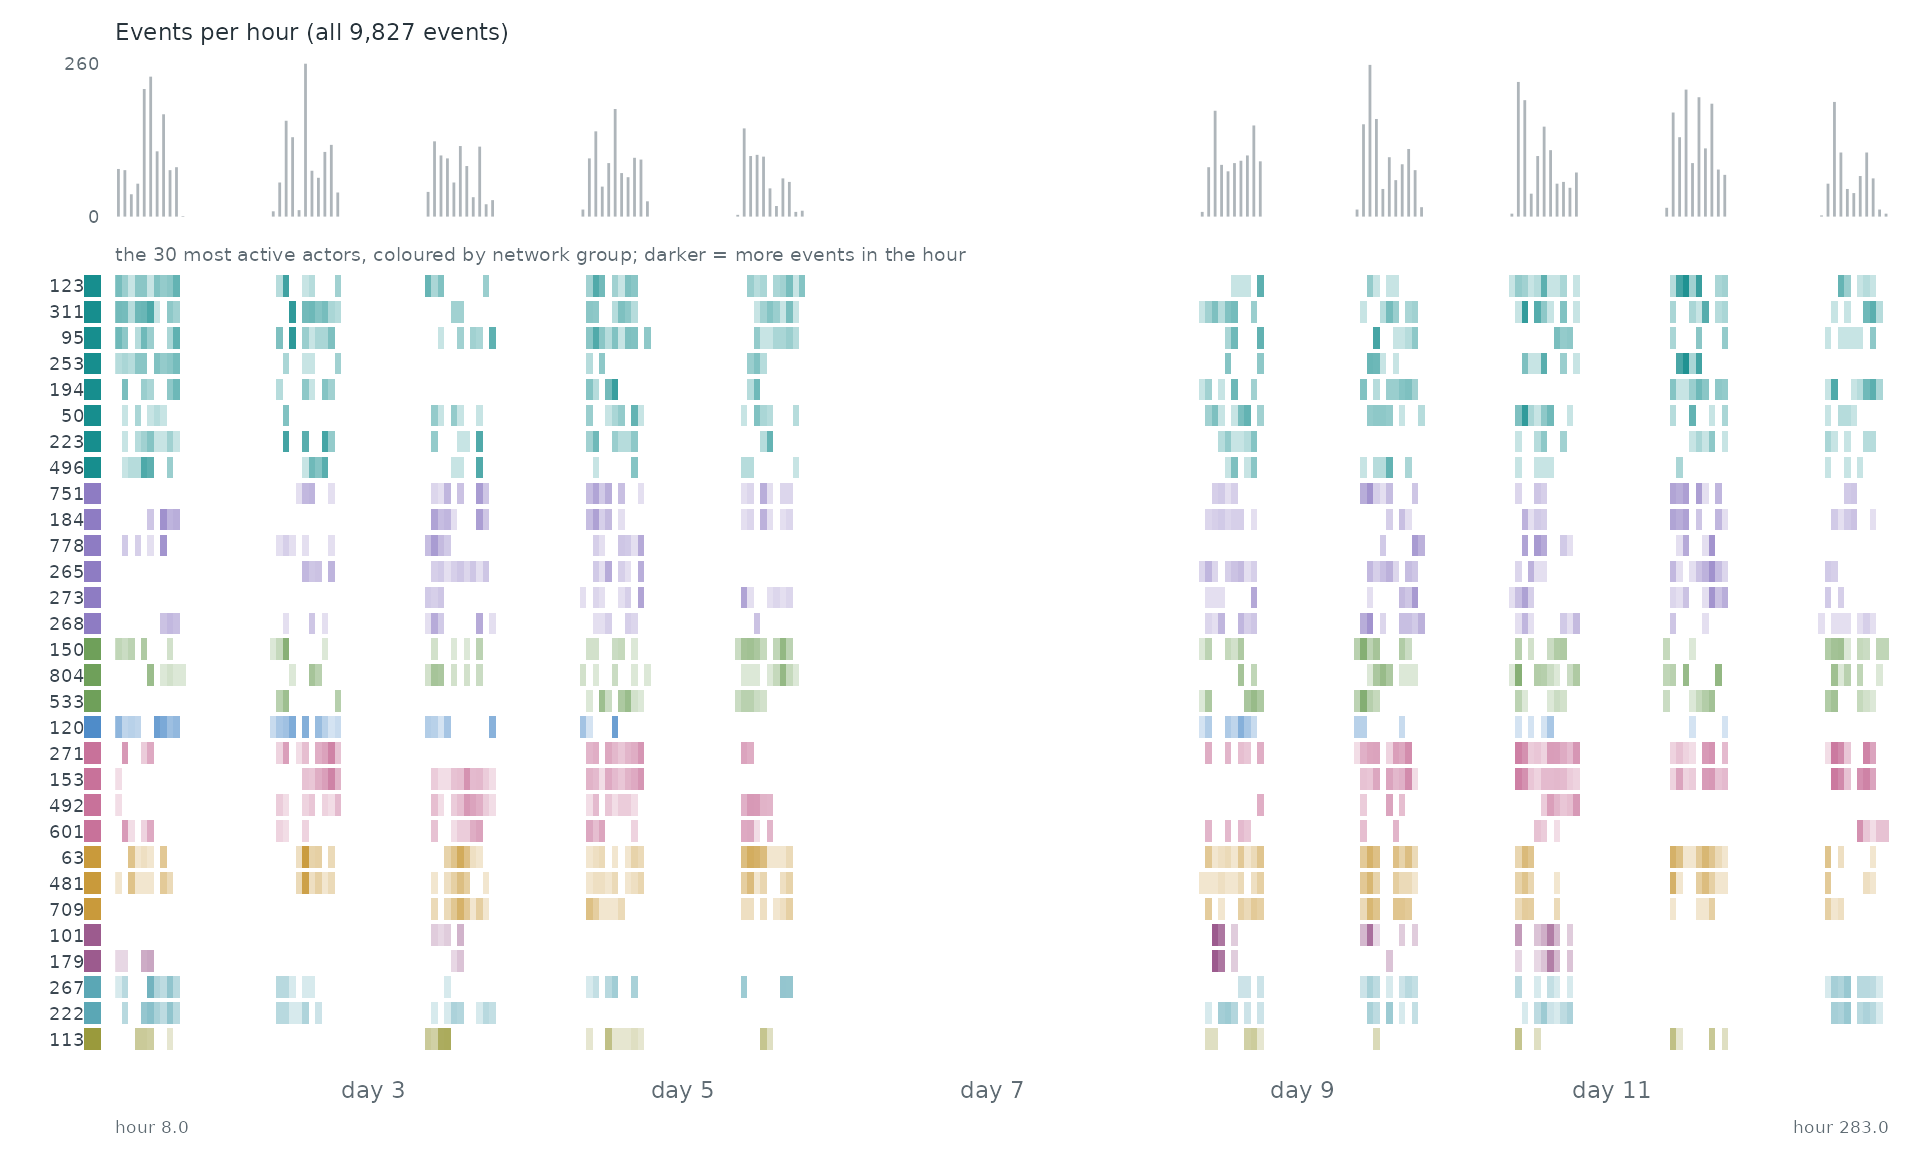
When. Each row is one of the 30 most active actors of the network, coloured by its group there; a cell is darker the more events (with anyone) the actor took part in during that stretch of time. The grey bars on top count all 9,827 events.
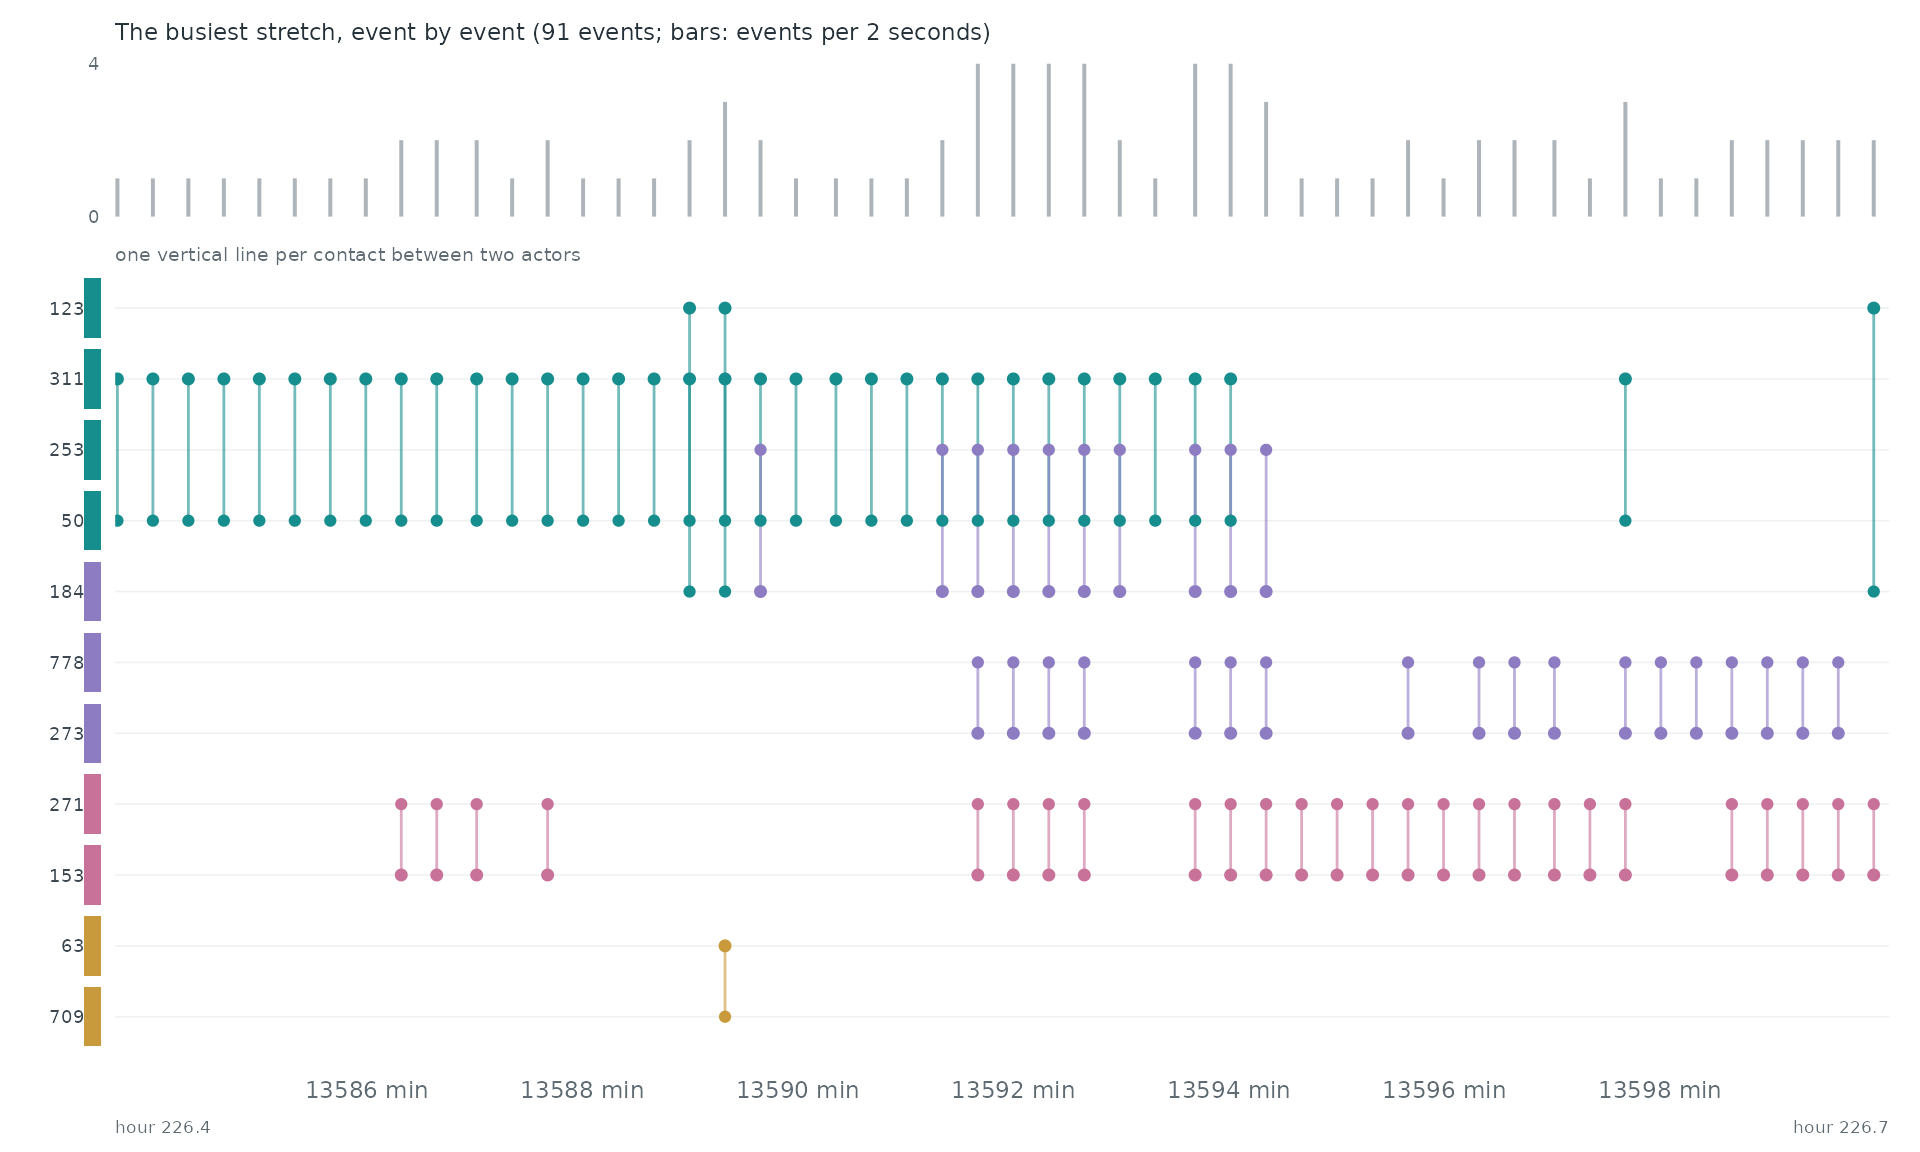
Event by event. The busiest stretch of the record, hour 226.4 to hour 226.7, event by event: each vertical line is one event between two of the actors above.
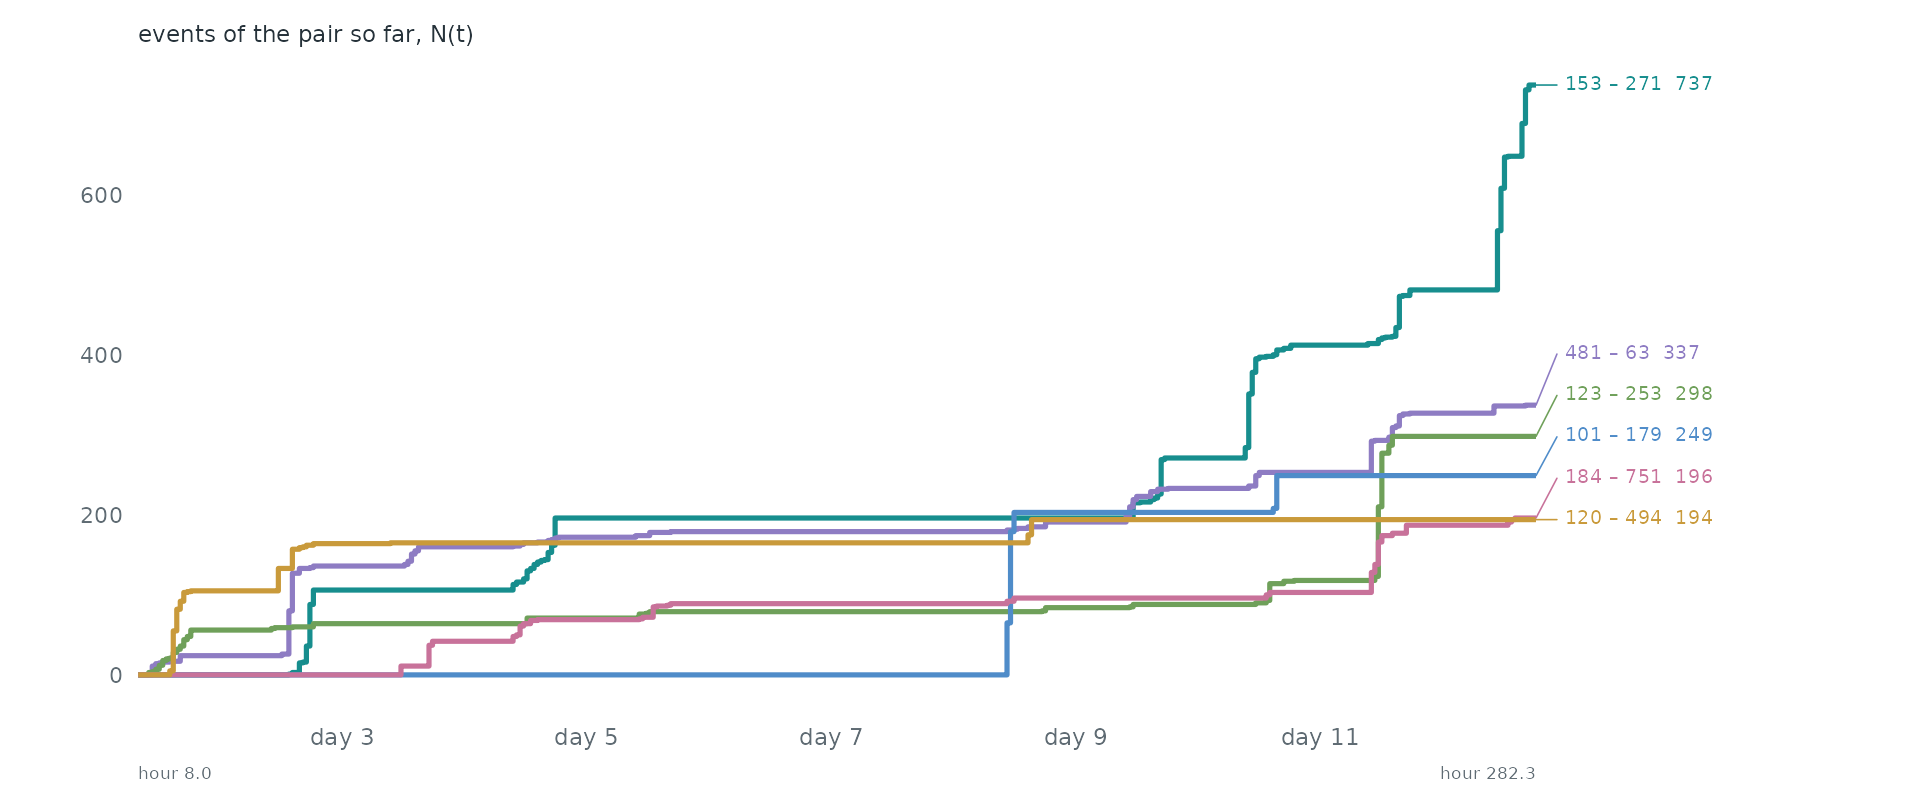
Pairs as counting processes. The counting process N(t) of the 6 busiest pairs: the number of events of the pair up to time t. Together they make 20.5% of all events. Steep stretches are bursts and flat ones silences.
Statistical profile.
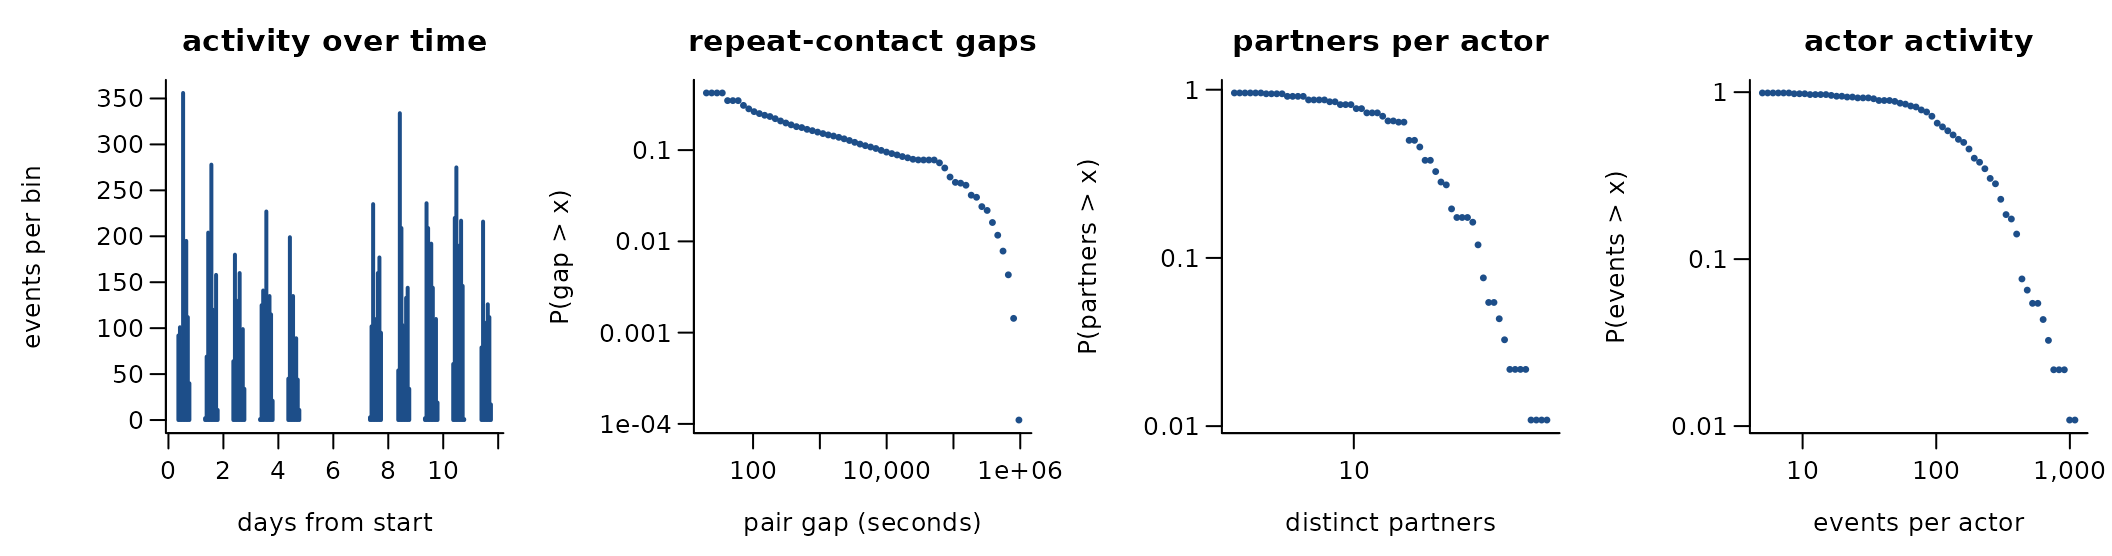
9,827 undirected contacts among 92 actors over 11.4 days (755 distinct pairs). 92.3% of events repeat an earlier pair; if every event chose a pair at random the share would be 61.5%. The burstiness coefficient of the gaps between successive events of the same pair is 0.63 (0 for a Poisson process, positive when events cluster in bursts); the most active tenth of the actors take part in 32.1% of events (Gini 0.45). 27.7% of events share their time stamp with an earlier one. office building, 2013
Get the data
download.file("https://sociopatterns.org/assets/data/workplace_InVS_metadata.txt", "workplace_InVS_metadata.txt", mode = "wb")
download.file("https://sociopatterns.org/assets/data/workplace_InVS_tij.dat.zip", "workplace_InVS_tij.dat.zip", mode = "wb")
A reader that turns these files into a
(sender, receiver, time) table is
readers[["sp-workplace-invs13"]] in data-raw/catalogue/readers.R.
SocioPatterns: workplace contacts 2015 (InVS)
Source: https://www.sociopatterns.org/datasets/high-school-contact-and-friendship-networks/ · Licence: CC BY-NC-SA · Status in amorem: non-commercial: not redistributable in amorem (MIT); obtain from the source.
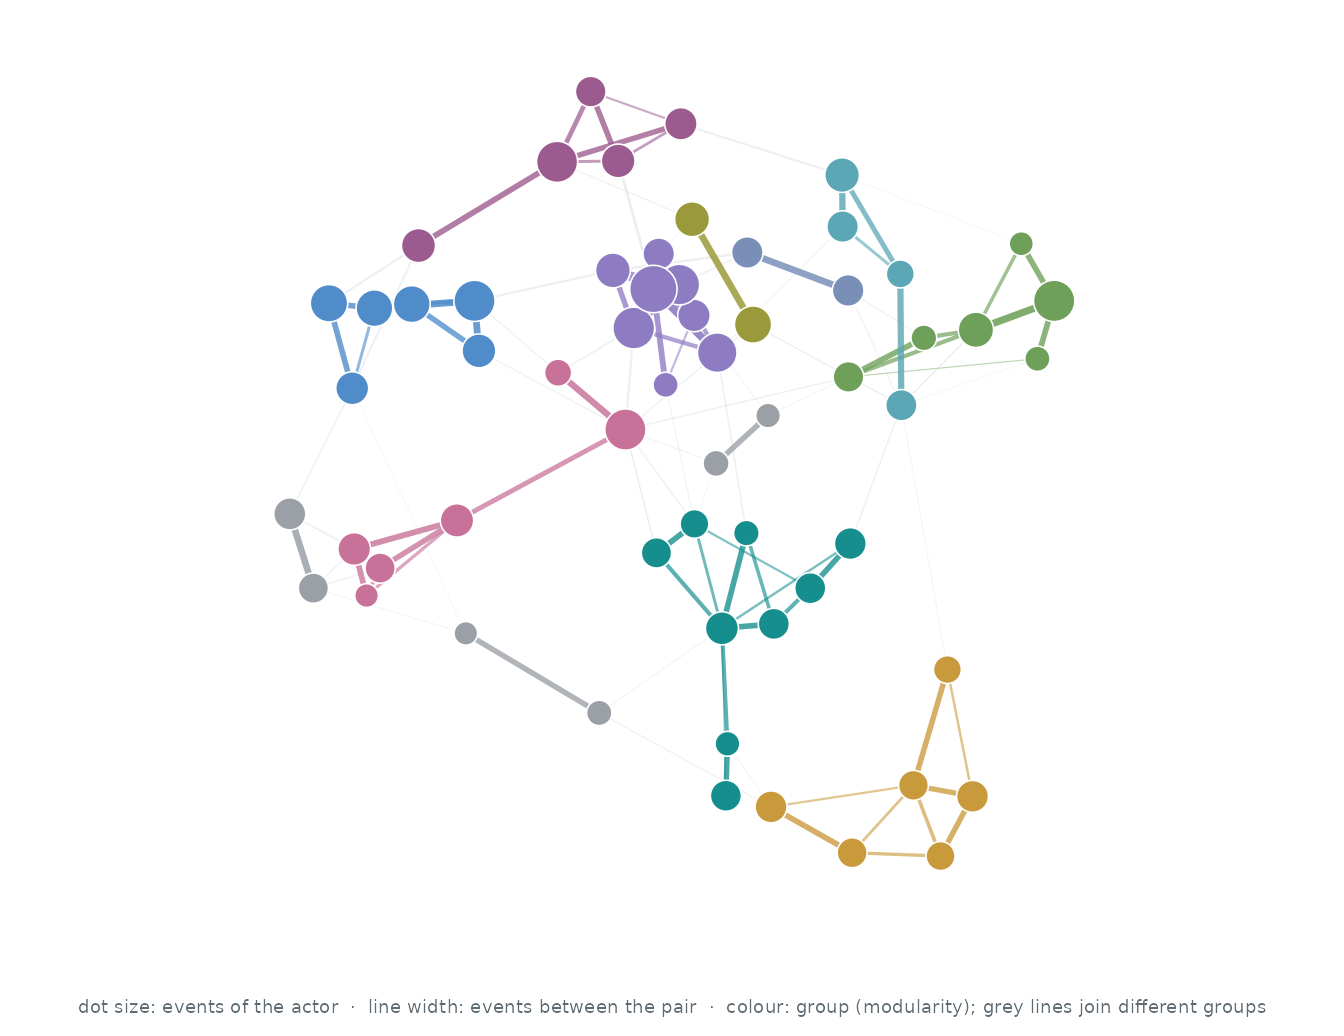
Who interacts with whom. The 60 actors of the busiest pairs, out of 217; events between two of them are 28.2% of all events. Each actor’s three strongest ties are drawn (120 of 433 pairs that ever interacted): wider, darker lines carry more events, larger dots are more active actors, and colours are groups found by modularity (Louvain).
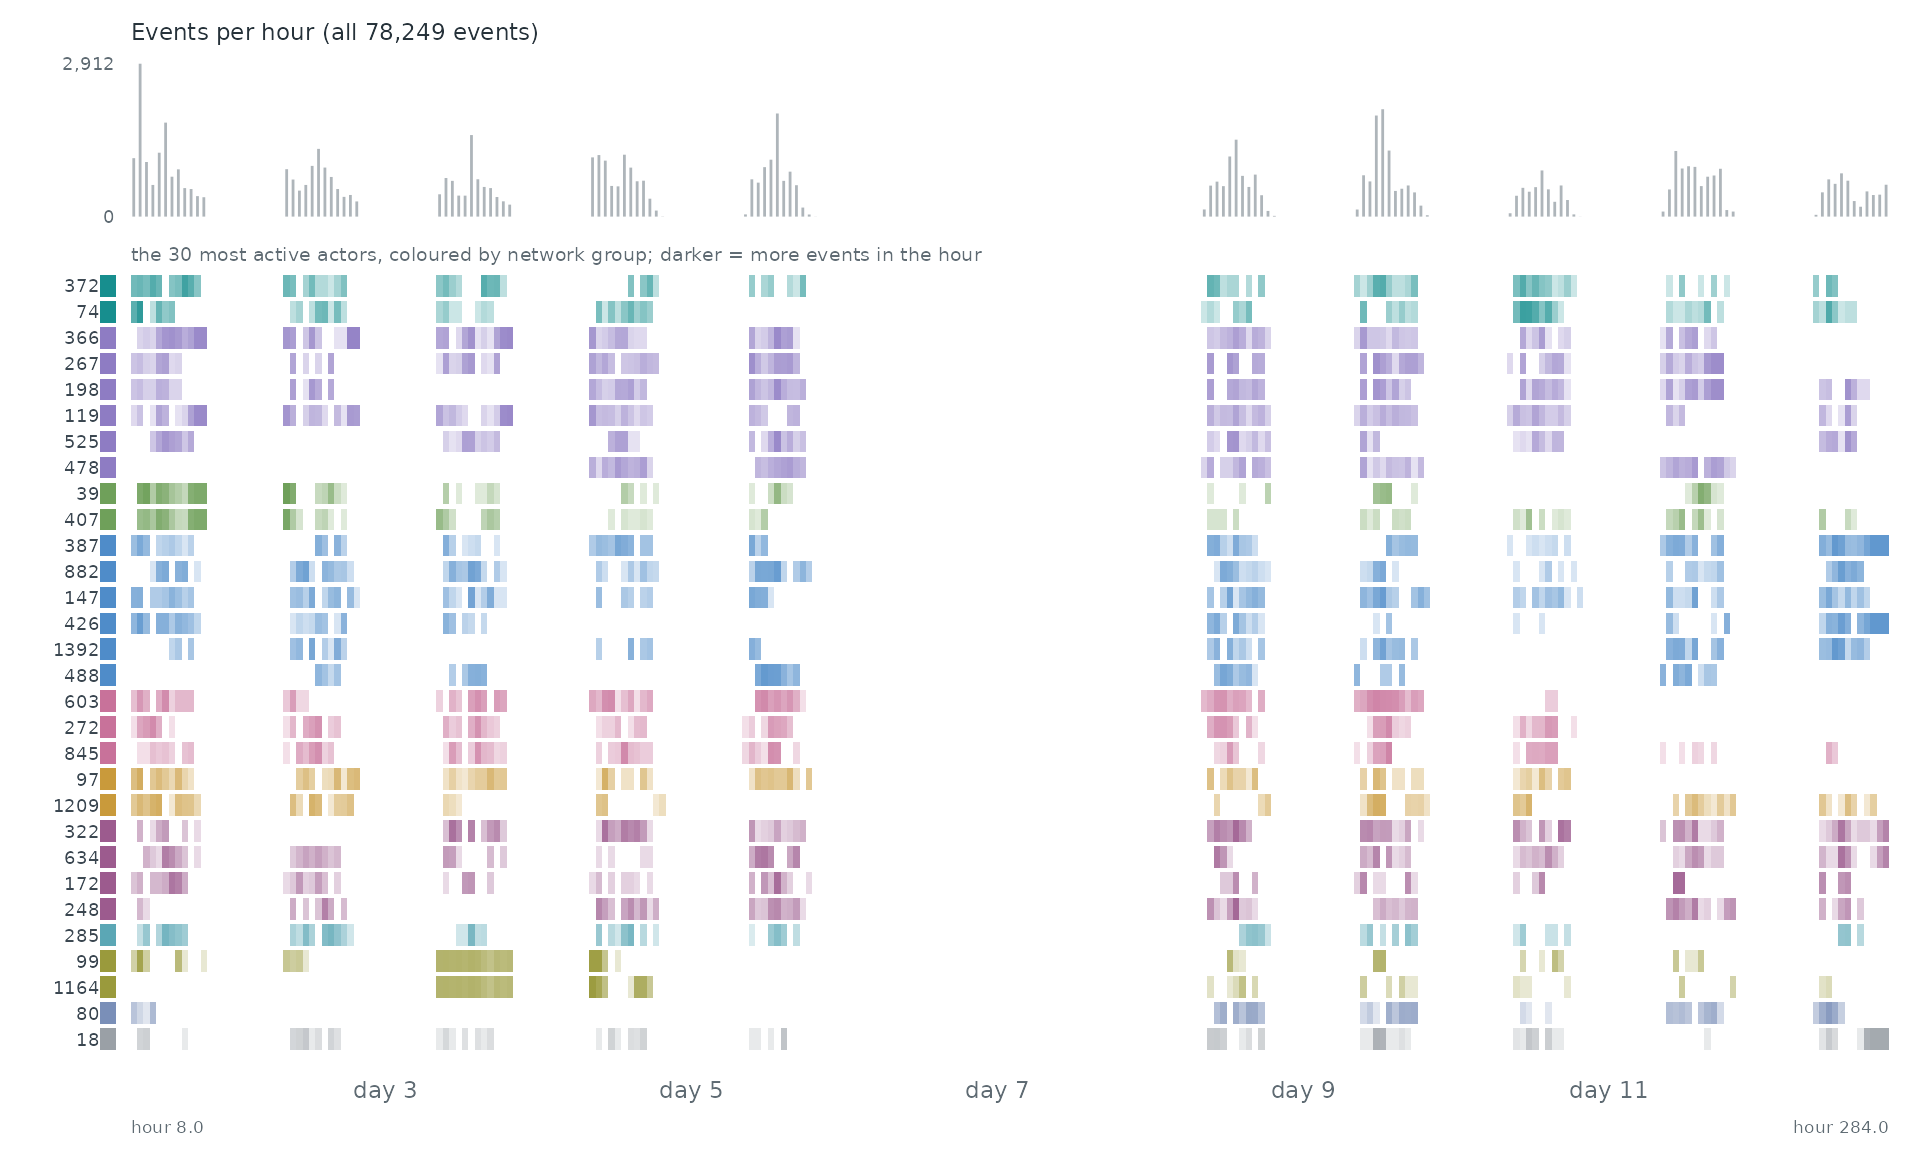
When. Each row is one of the 30 most active actors of the network, coloured by its group there; a cell is darker the more events (with anyone) the actor took part in during that stretch of time. The grey bars on top count all 78,249 events.
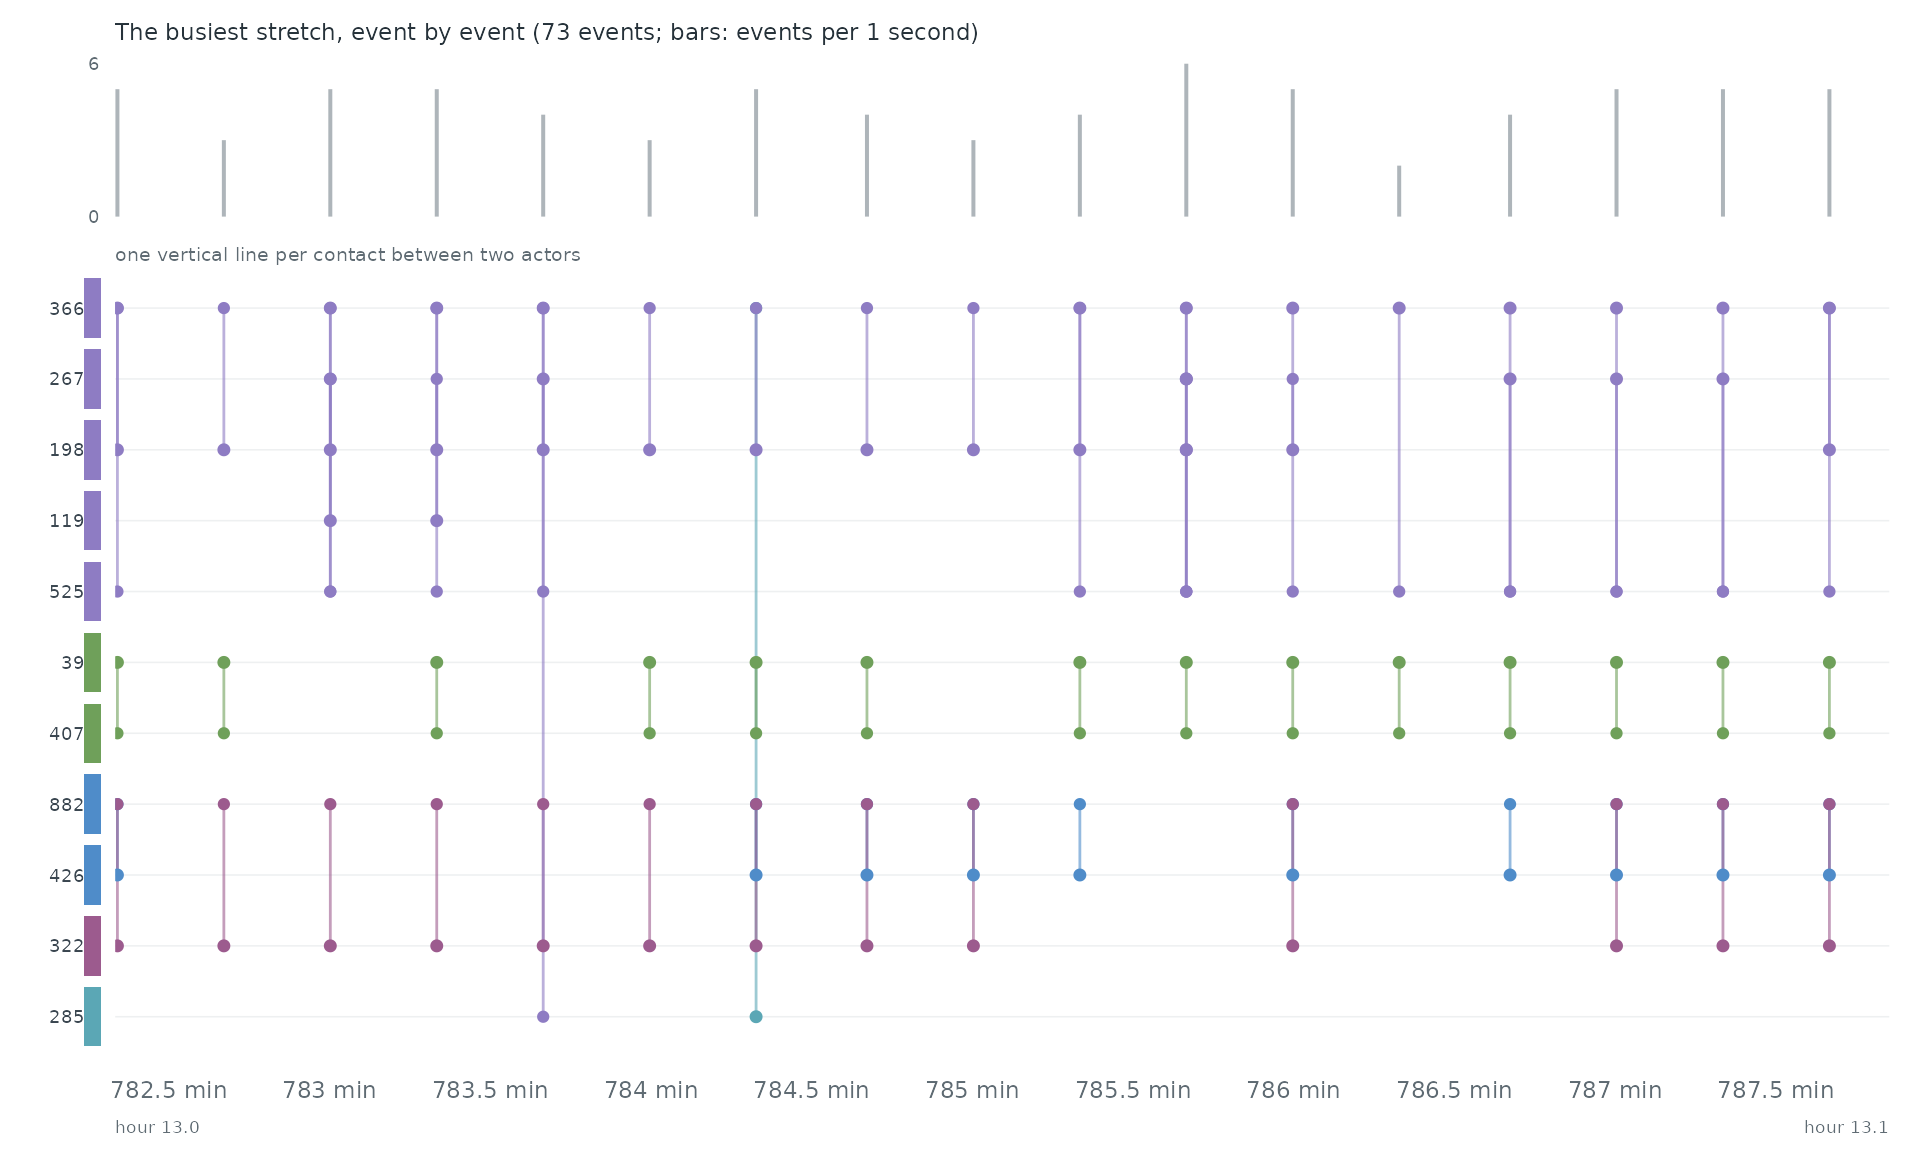
Event by event. The busiest stretch of the record, hour 13.0 to hour 13.1, event by event: each vertical line is one event between two of the actors above.
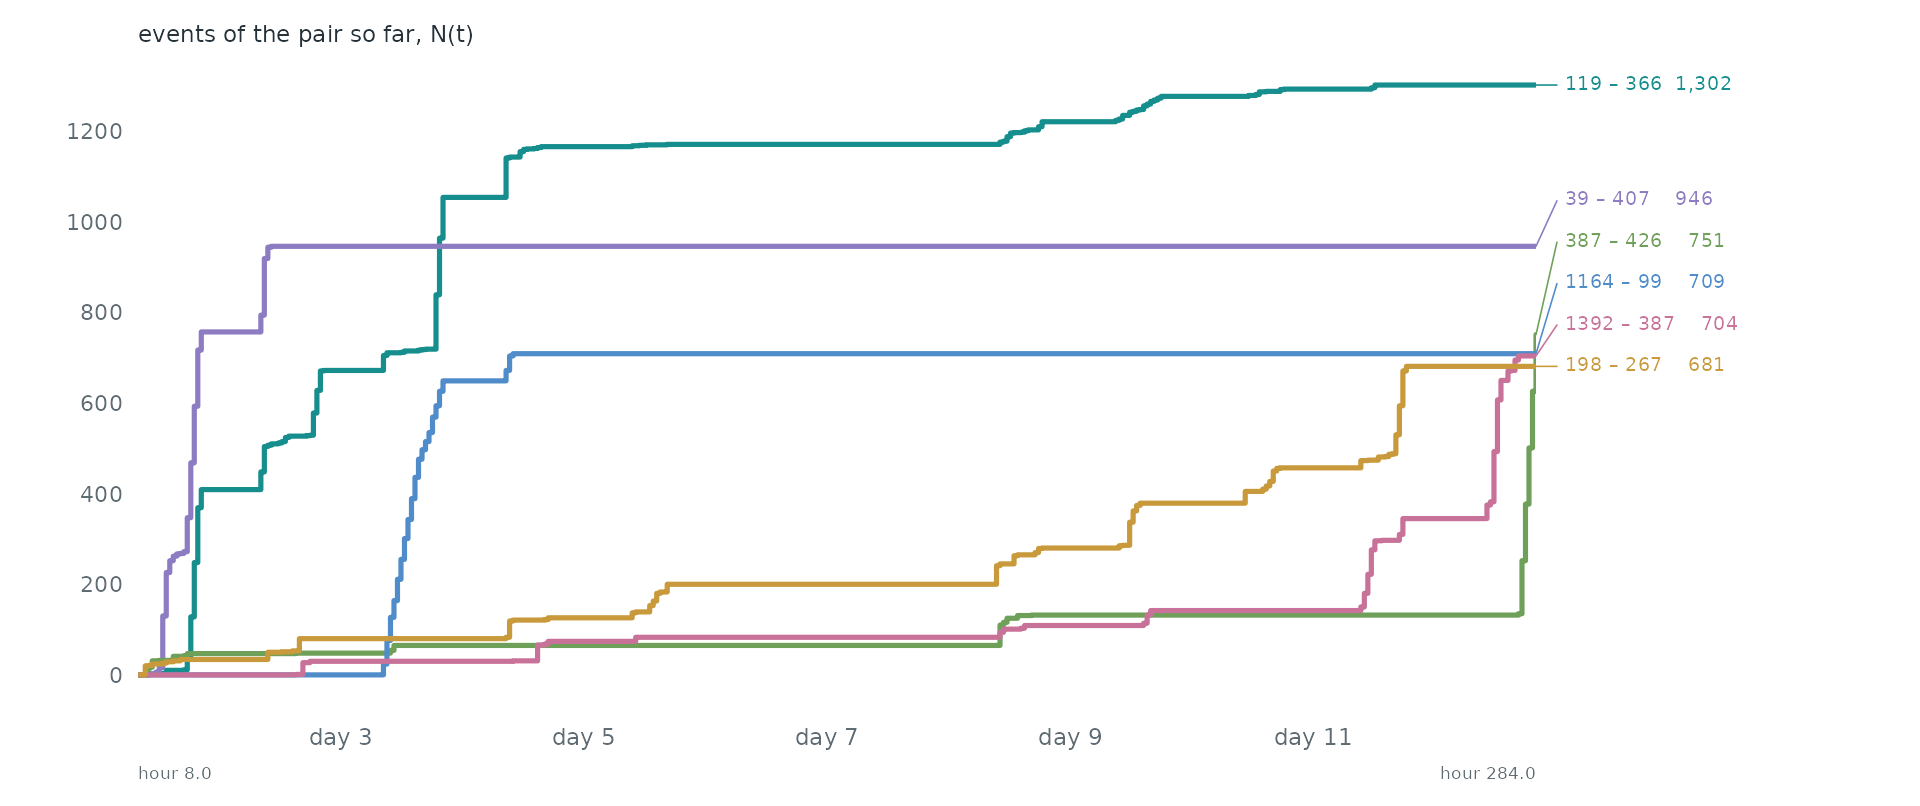
Pairs as counting processes. The counting process N(t) of the 6 busiest pairs: the number of events of the pair up to time t. Together they make 6.5% of all events. Steep stretches are bursts and flat ones silences.
Statistical profile.
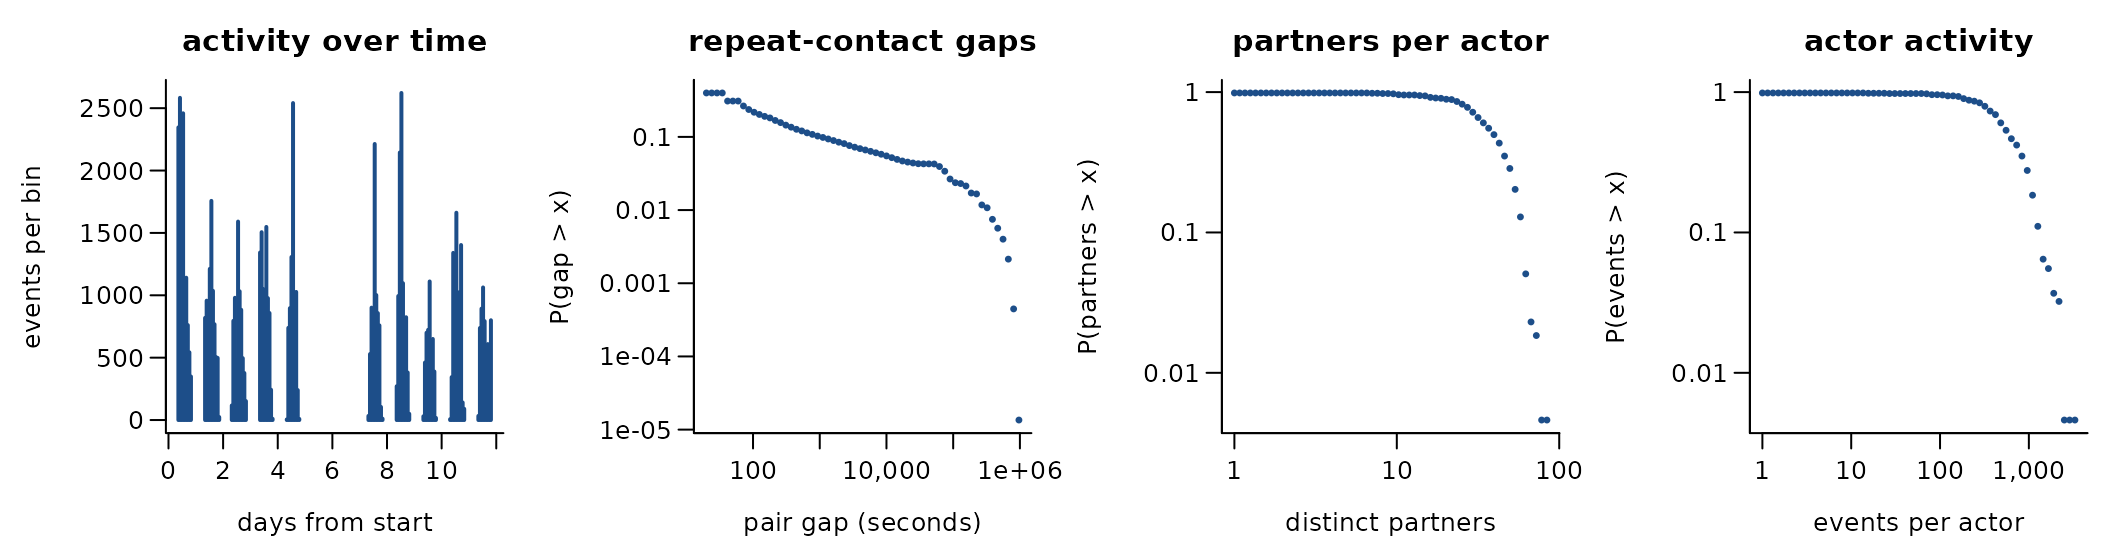
78,249 undirected contacts among 217 actors over 11.5 days (4,274 distinct pairs). 94.5% of events repeat an earlier pair; if every event chose a pair at random the share would be 71.1%. The burstiness coefficient of the gaps between successive events of the same pair is 0.72 (0 for a Poisson process, positive when events cluster in bursts); the most active tenth of the actors take part in 25.6% of events (Gini 0.38). 76.4% of events share their time stamp with an earlier one. office building, 2015
Get the data
download.file("https://sociopatterns.org/assets/data/workplace_InVS15_metadata.txt", "workplace_InVS15_metadata.txt", mode = "wb")
download.file("https://sociopatterns.org/assets/data/workplace_InVS15_tij.dat.gz", "workplace_InVS15_tij.dat.gz", mode = "wb")
A reader that turns these files into a
(sender, receiver, time) table is
readers[["sp-workplace-invs15"]] in data-raw/catalogue/readers.R.
SocioPatterns: ACM Hypertext 2009 conference contacts
Source: https://www.sociopatterns.org/datasets/high-school-contact-and-friendship-networks/ · Licence: CC BY-NC-SA · Status in amorem: non-commercial: not redistributable in amorem (MIT); obtain from the source.
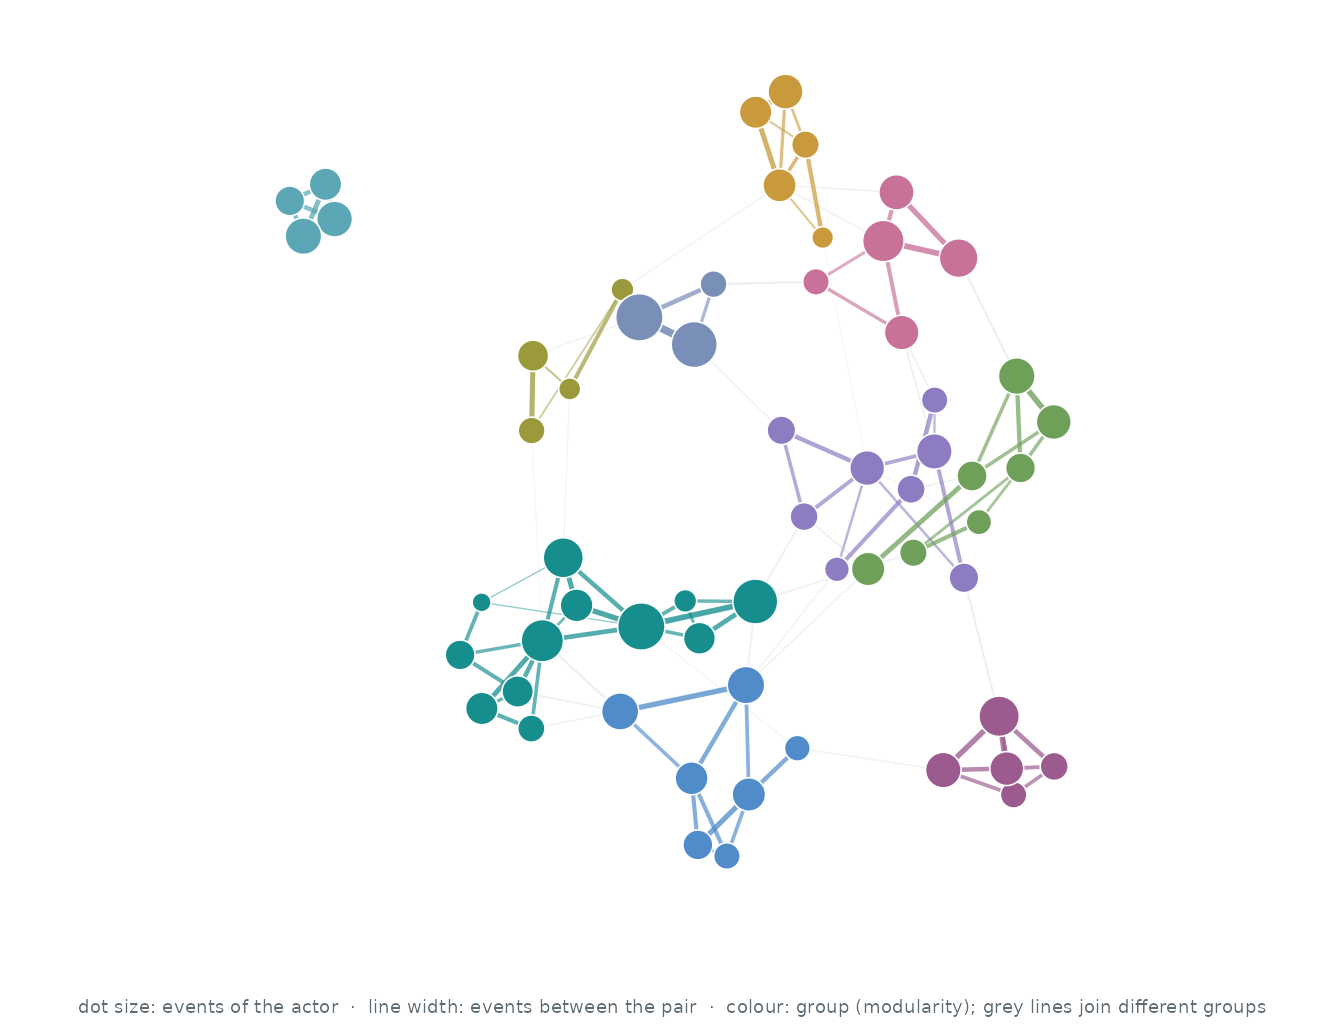
Who interacts with whom. The 60 actors of the busiest pairs, out of 113; events between two of them are 67.5% of all events. Each actor’s three strongest ties are drawn (113 of 867 pairs that ever interacted): wider, darker lines carry more events, larger dots are more active actors, and colours are groups found by modularity (Louvain).
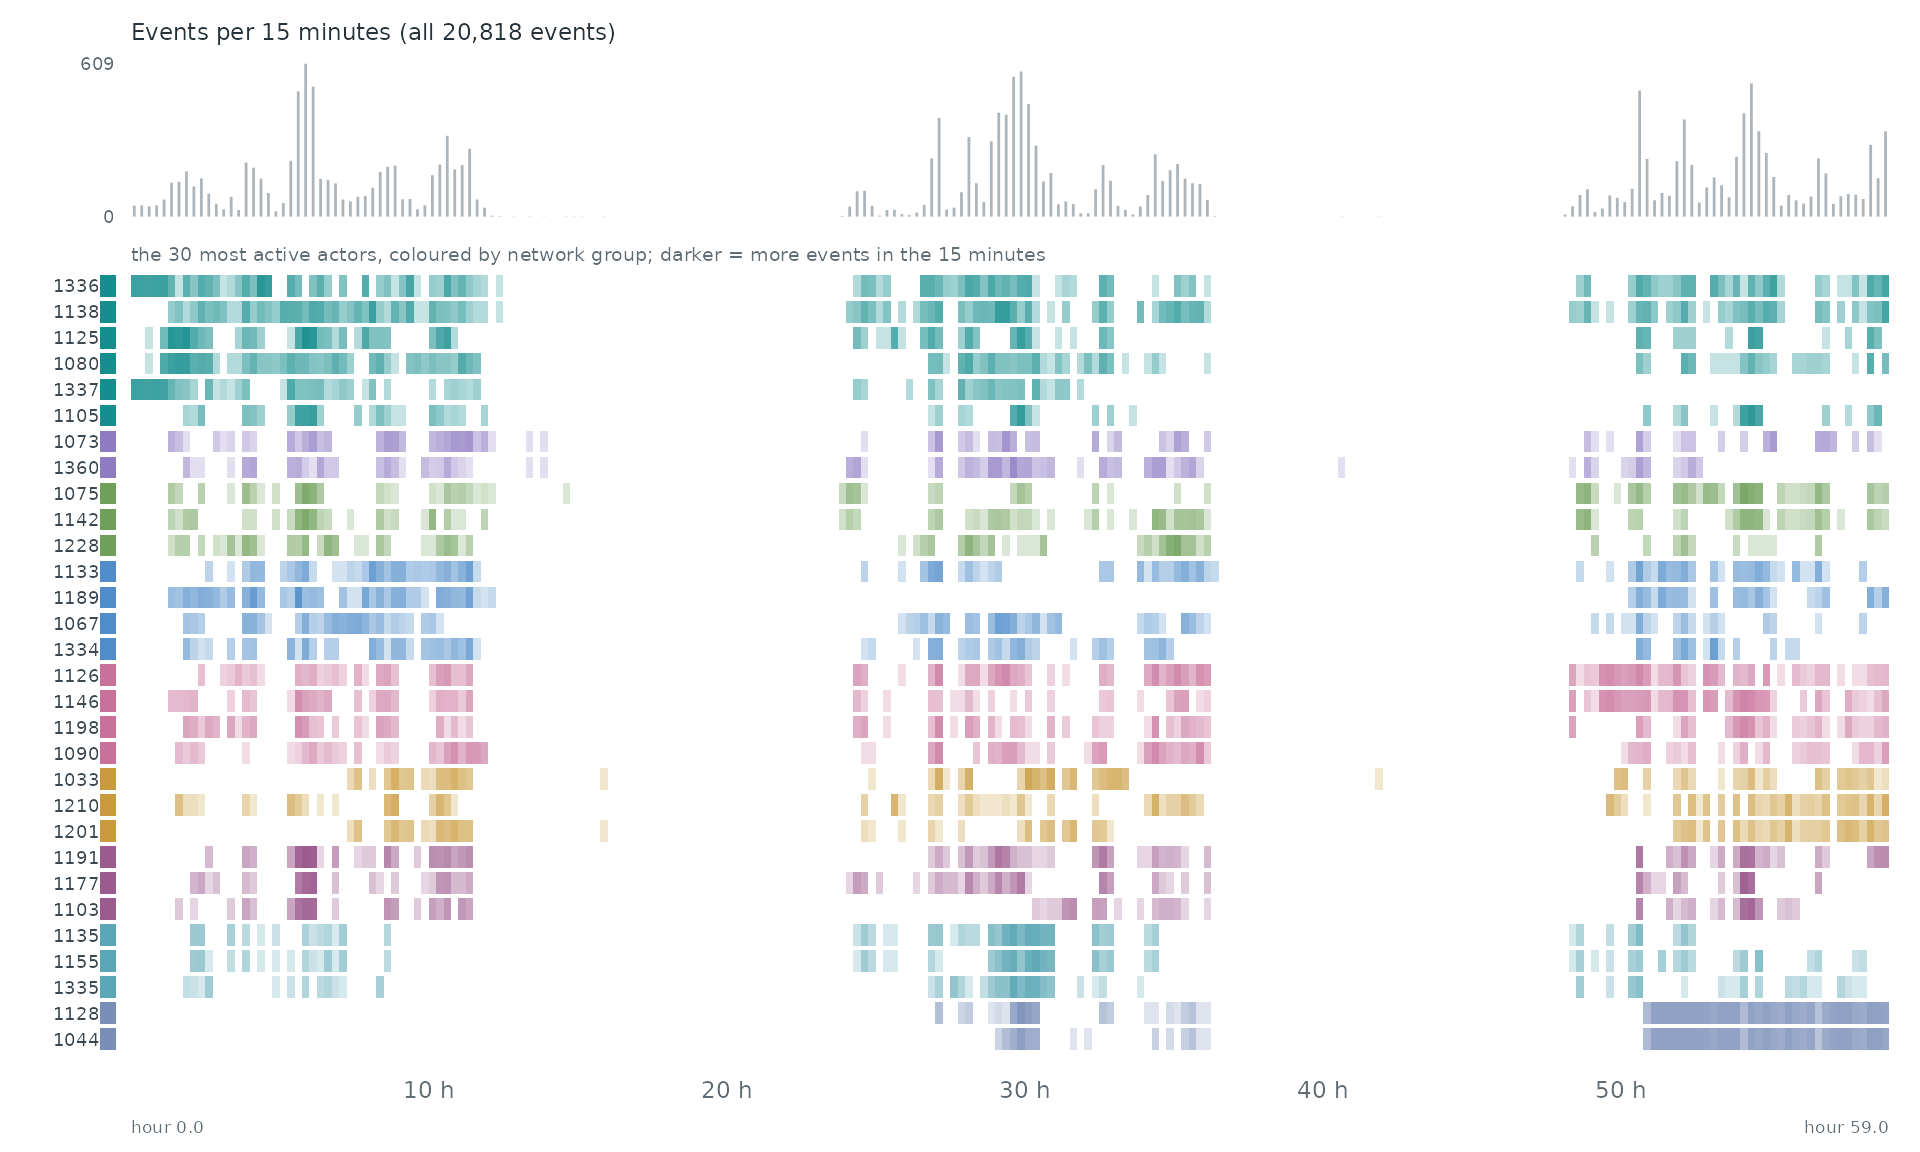
When. Each row is one of the 30 most active actors of the network, coloured by its group there; a cell is darker the more events (with anyone) the actor took part in during that stretch of time. The grey bars on top count all 20,818 events.
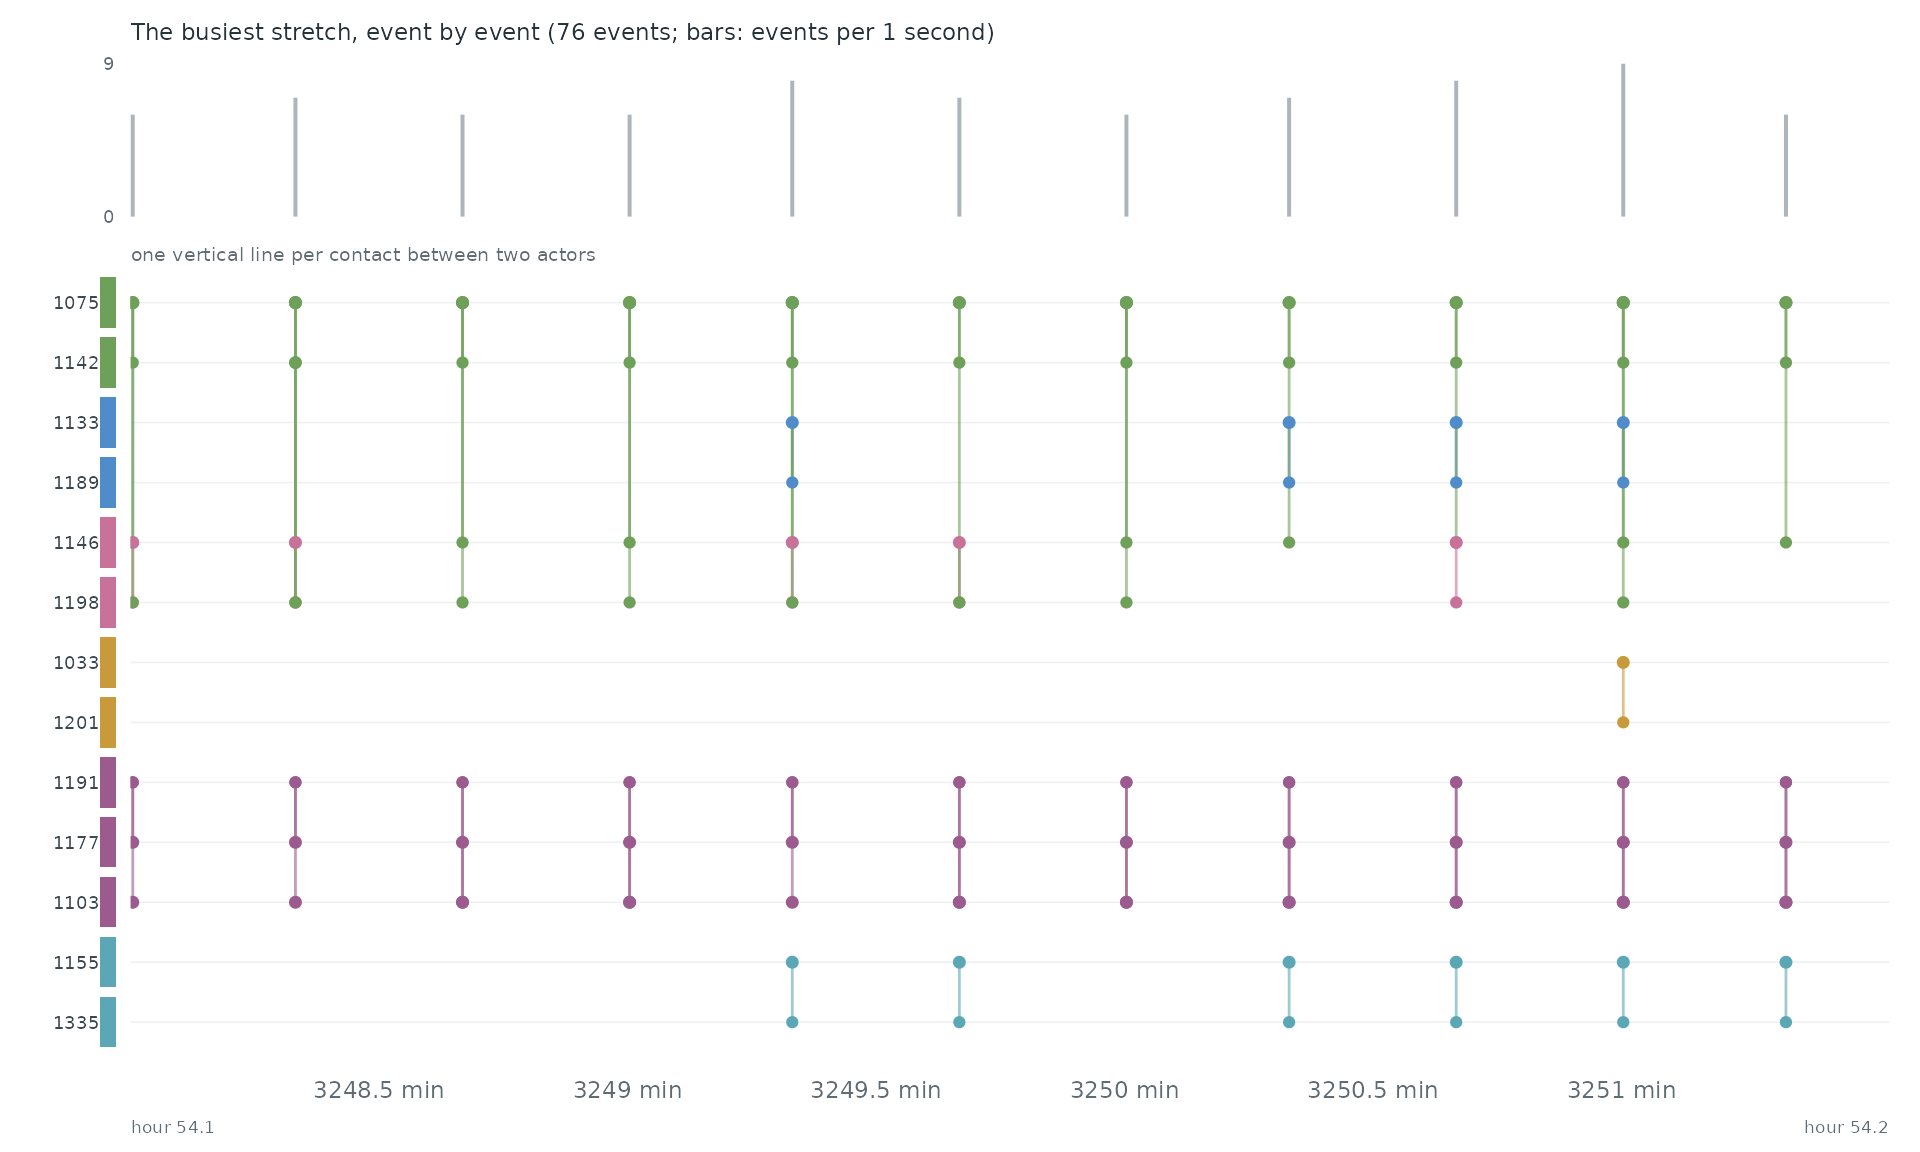
Event by event. The busiest stretch of the record, hour 54.1 to hour 54.2, event by event: each vertical line is one event between two of the actors above.
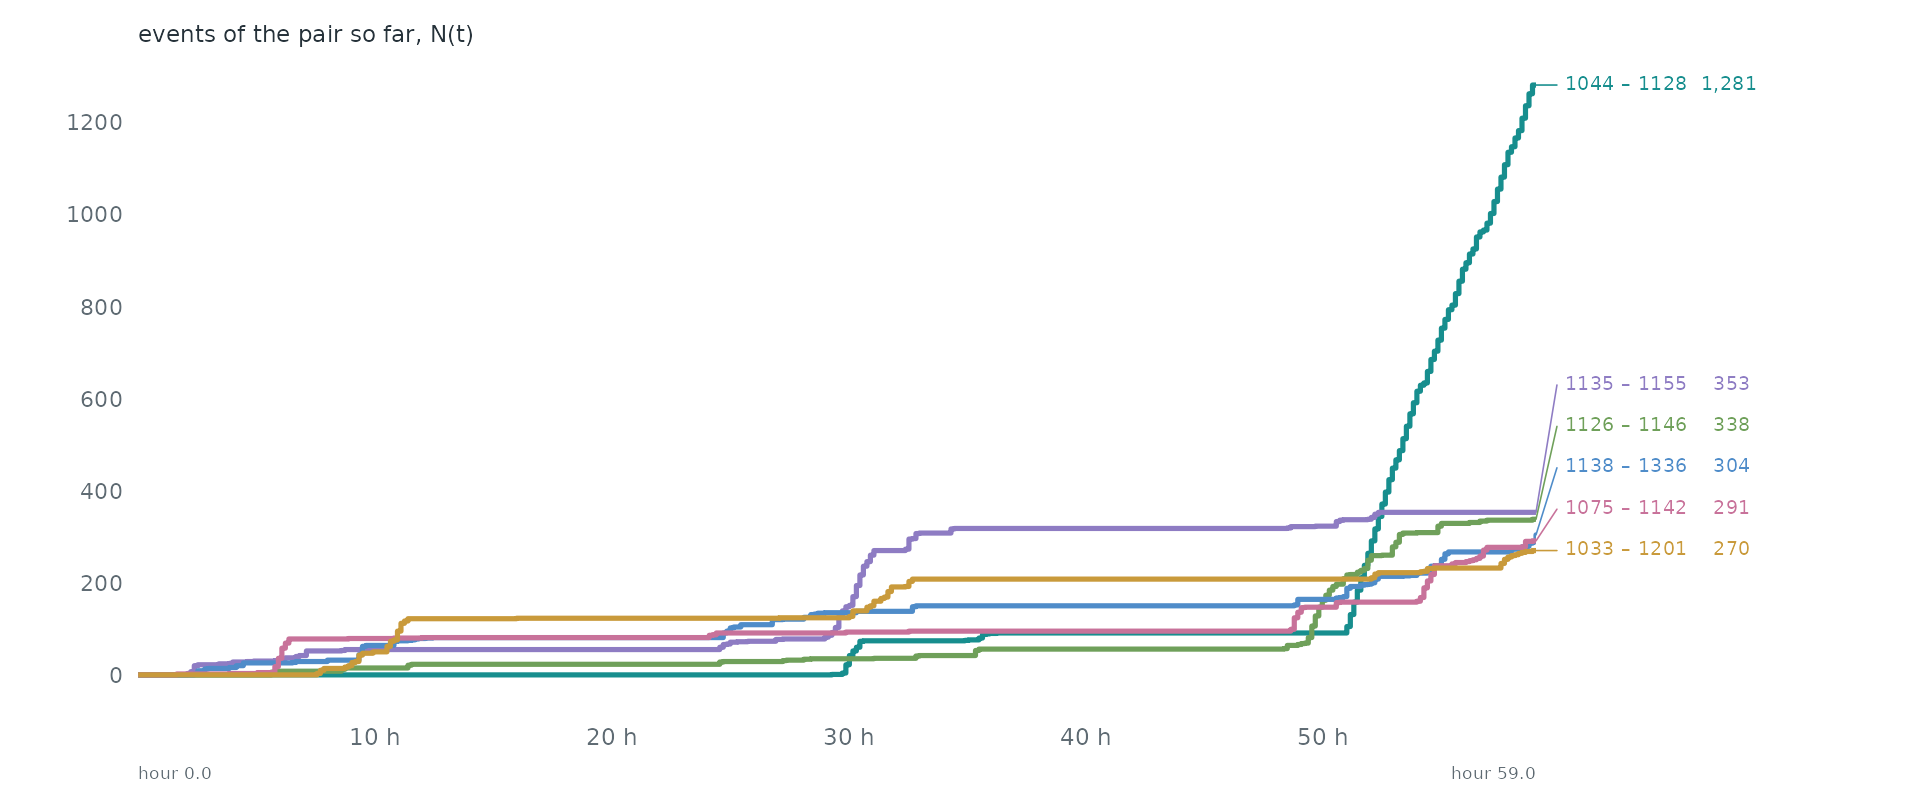
Pairs as counting processes. The counting process N(t) of the 6 busiest pairs: the number of events of the pair up to time t. Together they make 13.6% of all events. Steep stretches are bursts and flat ones silences.
Over time. day 2, 00:00 from start to day 2, 17:45 from start in windows of one 15 minutes (7,131 events in this span). Press play, or drag the bar to stop on a moment; the dark bar below the network marks the current window among all windows.
Statistical profile.
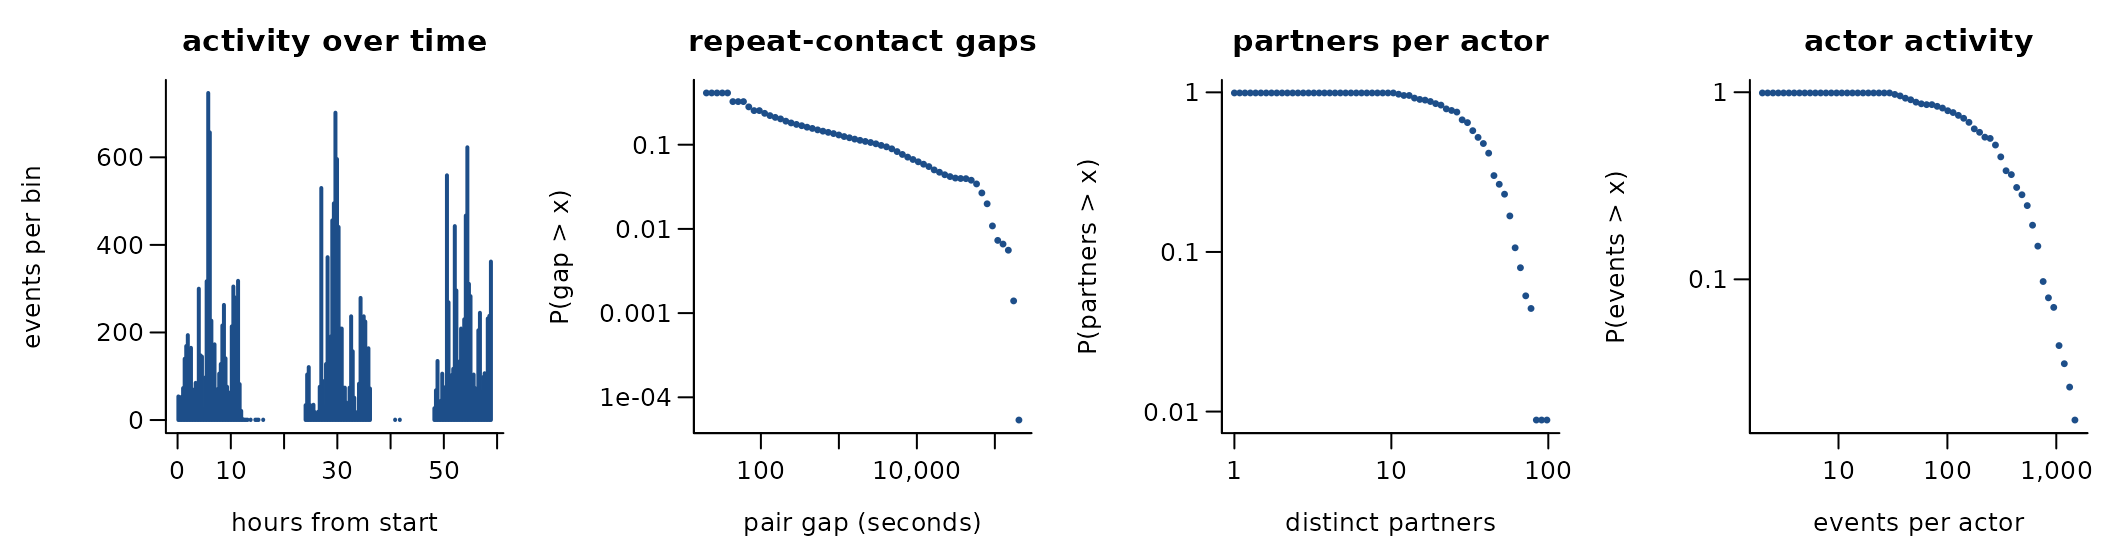
20,818 undirected contacts among 113 actors over 2.5 days (2,196 distinct pairs). 89.5% of events repeat an earlier pair; if every event chose a pair at random the share would be 70.7%. The burstiness coefficient of the gaps between successive events of the same pair is 0.63 (0 for a Poisson process, positive when events cluster in bursts); the most active tenth of the actors take part in 31.1% of events (Gini 0.46). 74.8% of events share their time stamp with an earlier one. ACM Hypertext 2009, three days
Get the data
download.file("https://sociopatterns.org/assets/data/ht2009_contact_intervals.json.gz", "ht2009_contact_intervals.json.gz", mode = "wb")
download.file("https://sociopatterns.org/assets/data/ht2009_contact_list.dat.gz", "ht2009_contact_list.dat.gz", mode = "wb")
A reader that turns these files into a
(sender, receiver, time) table is
readers[["sp-ht2009"]] in data-raw/catalogue/readers.R.
SocioPatterns: SFHH conference contacts (Nice)
Source: https://www.sociopatterns.org/datasets/high-school-contact-and-friendship-networks/ · Licence: CC BY-NC-SA · Status in amorem: non-commercial: not redistributable in amorem (MIT); obtain from the source.
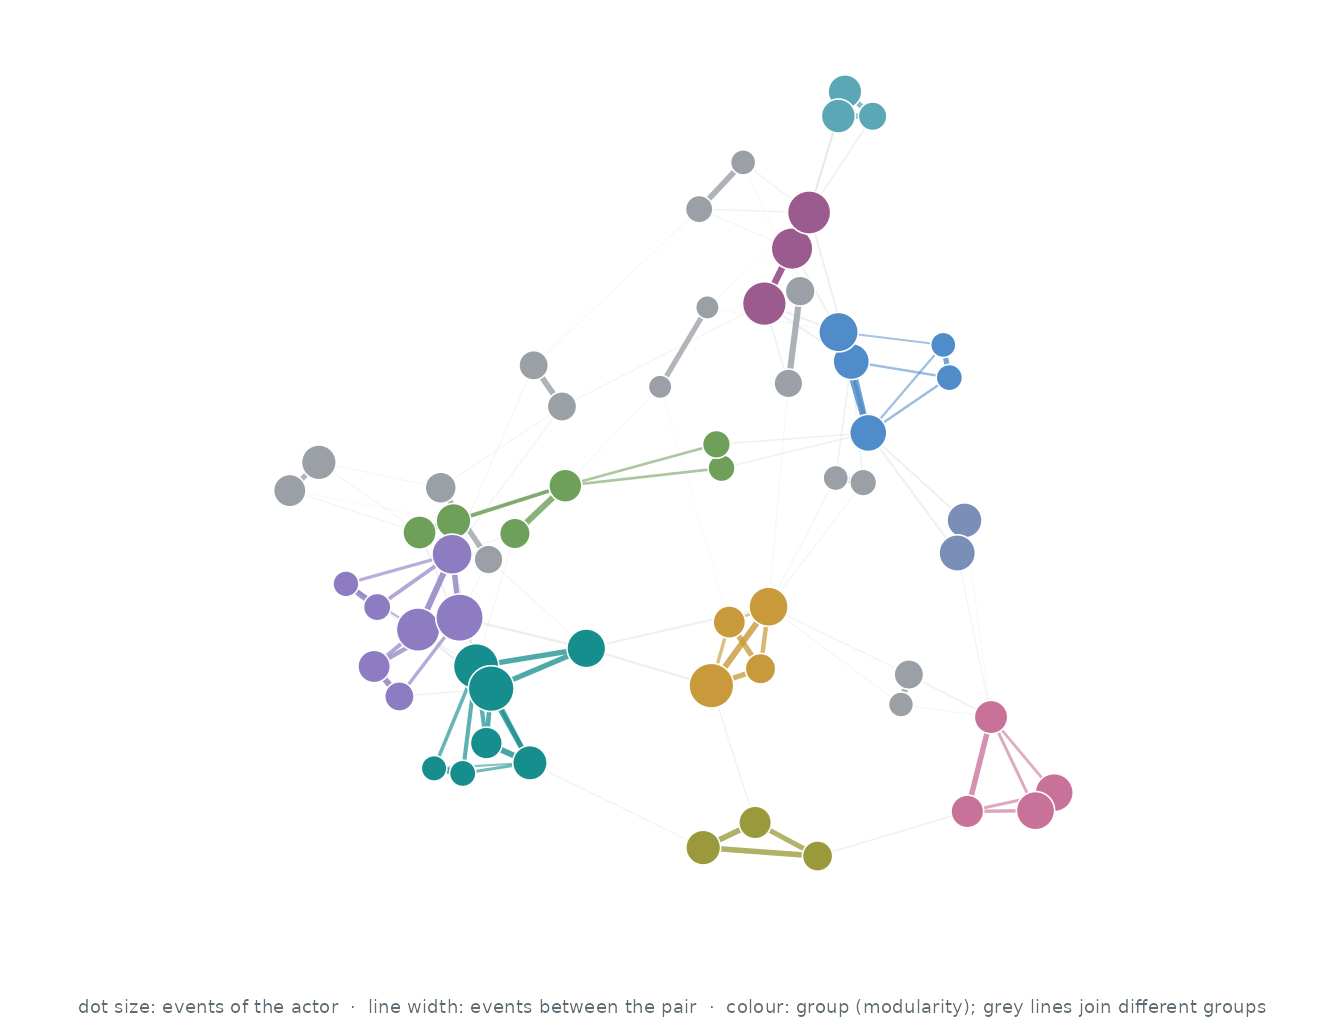
Who interacts with whom. The 60 actors of the busiest pairs, out of 403; events between two of them are 28.9% of all events. Each actor’s three strongest ties are drawn (129 of 514 pairs that ever interacted): wider, darker lines carry more events, larger dots are more active actors, and colours are groups found by modularity (Louvain).
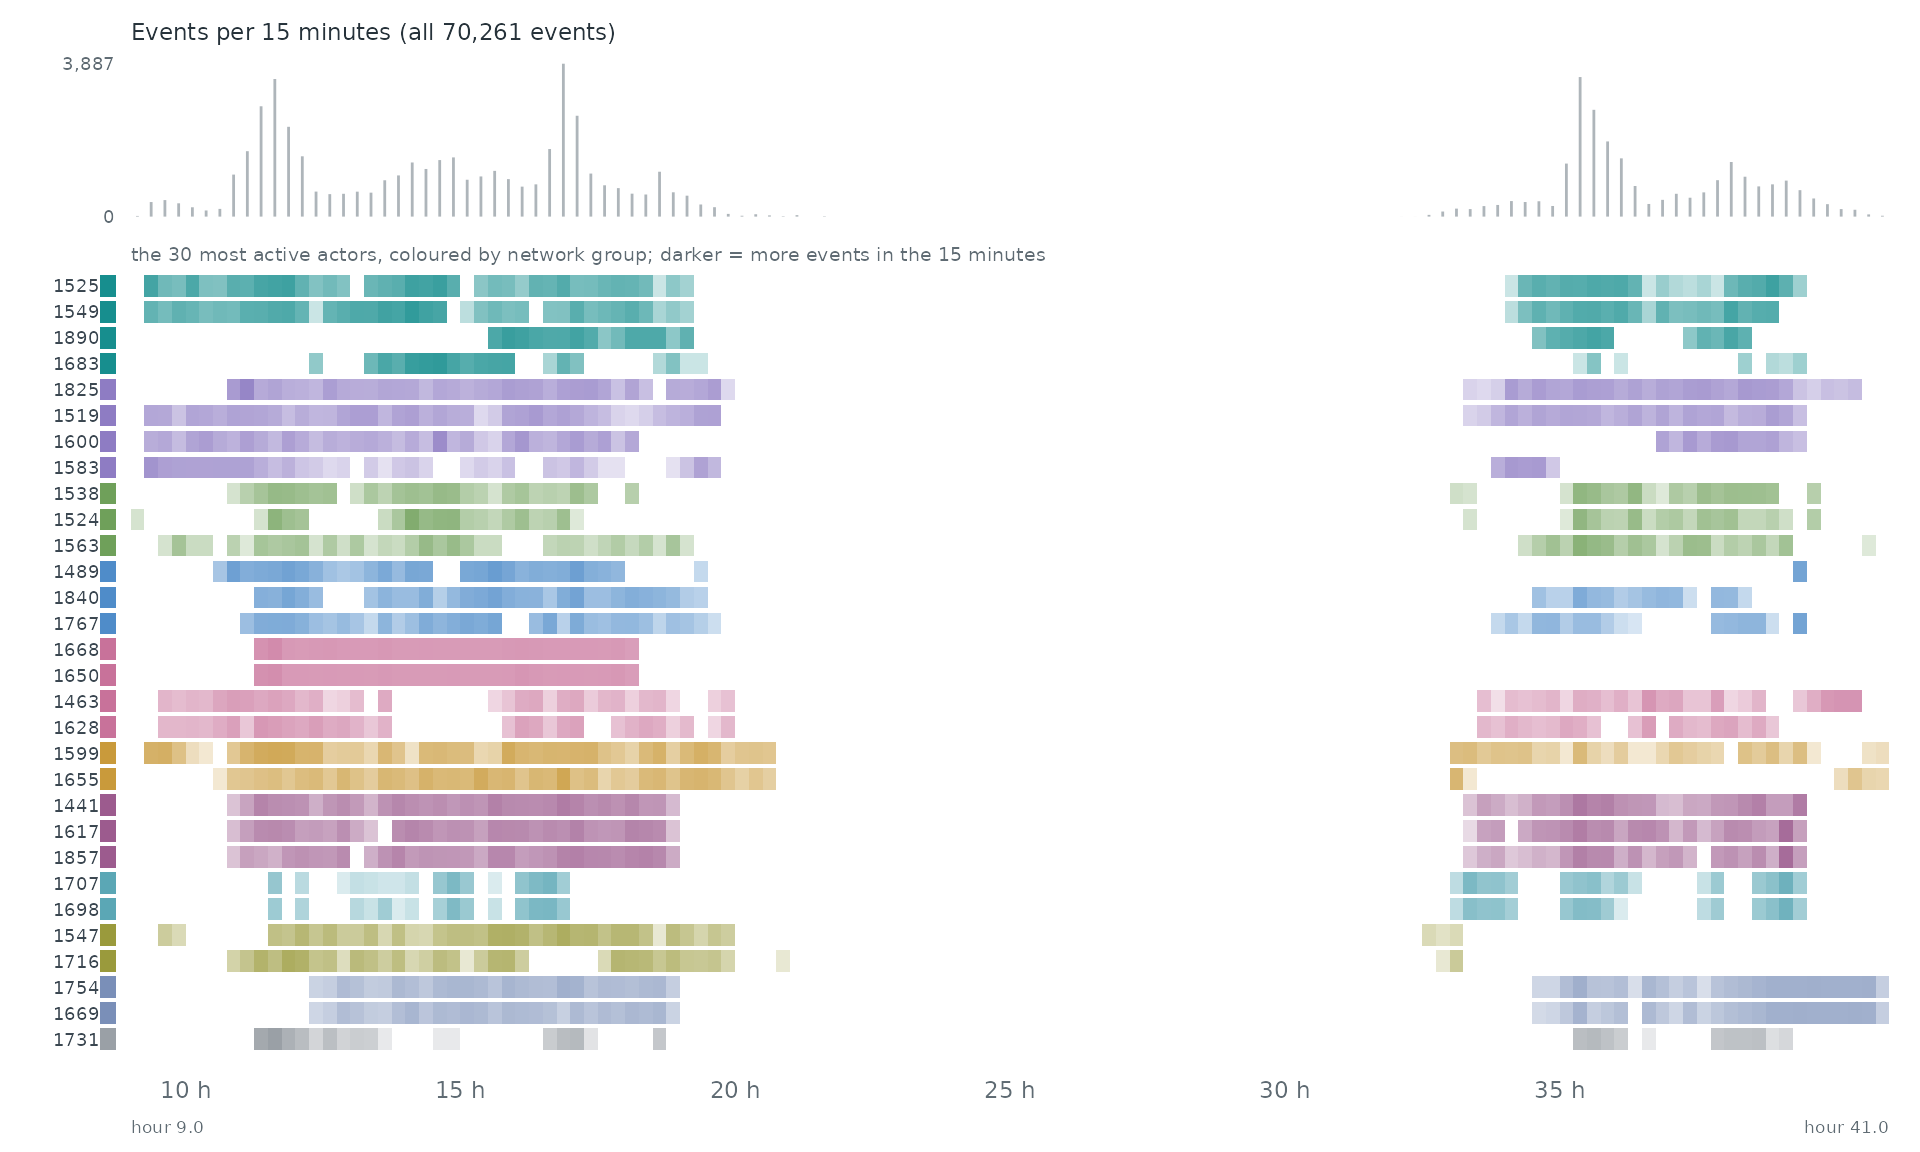
When. Each row is one of the 30 most active actors of the network, coloured by its group there; a cell is darker the more events (with anyone) the actor took part in during that stretch of time. The grey bars on top count all 70,261 events.
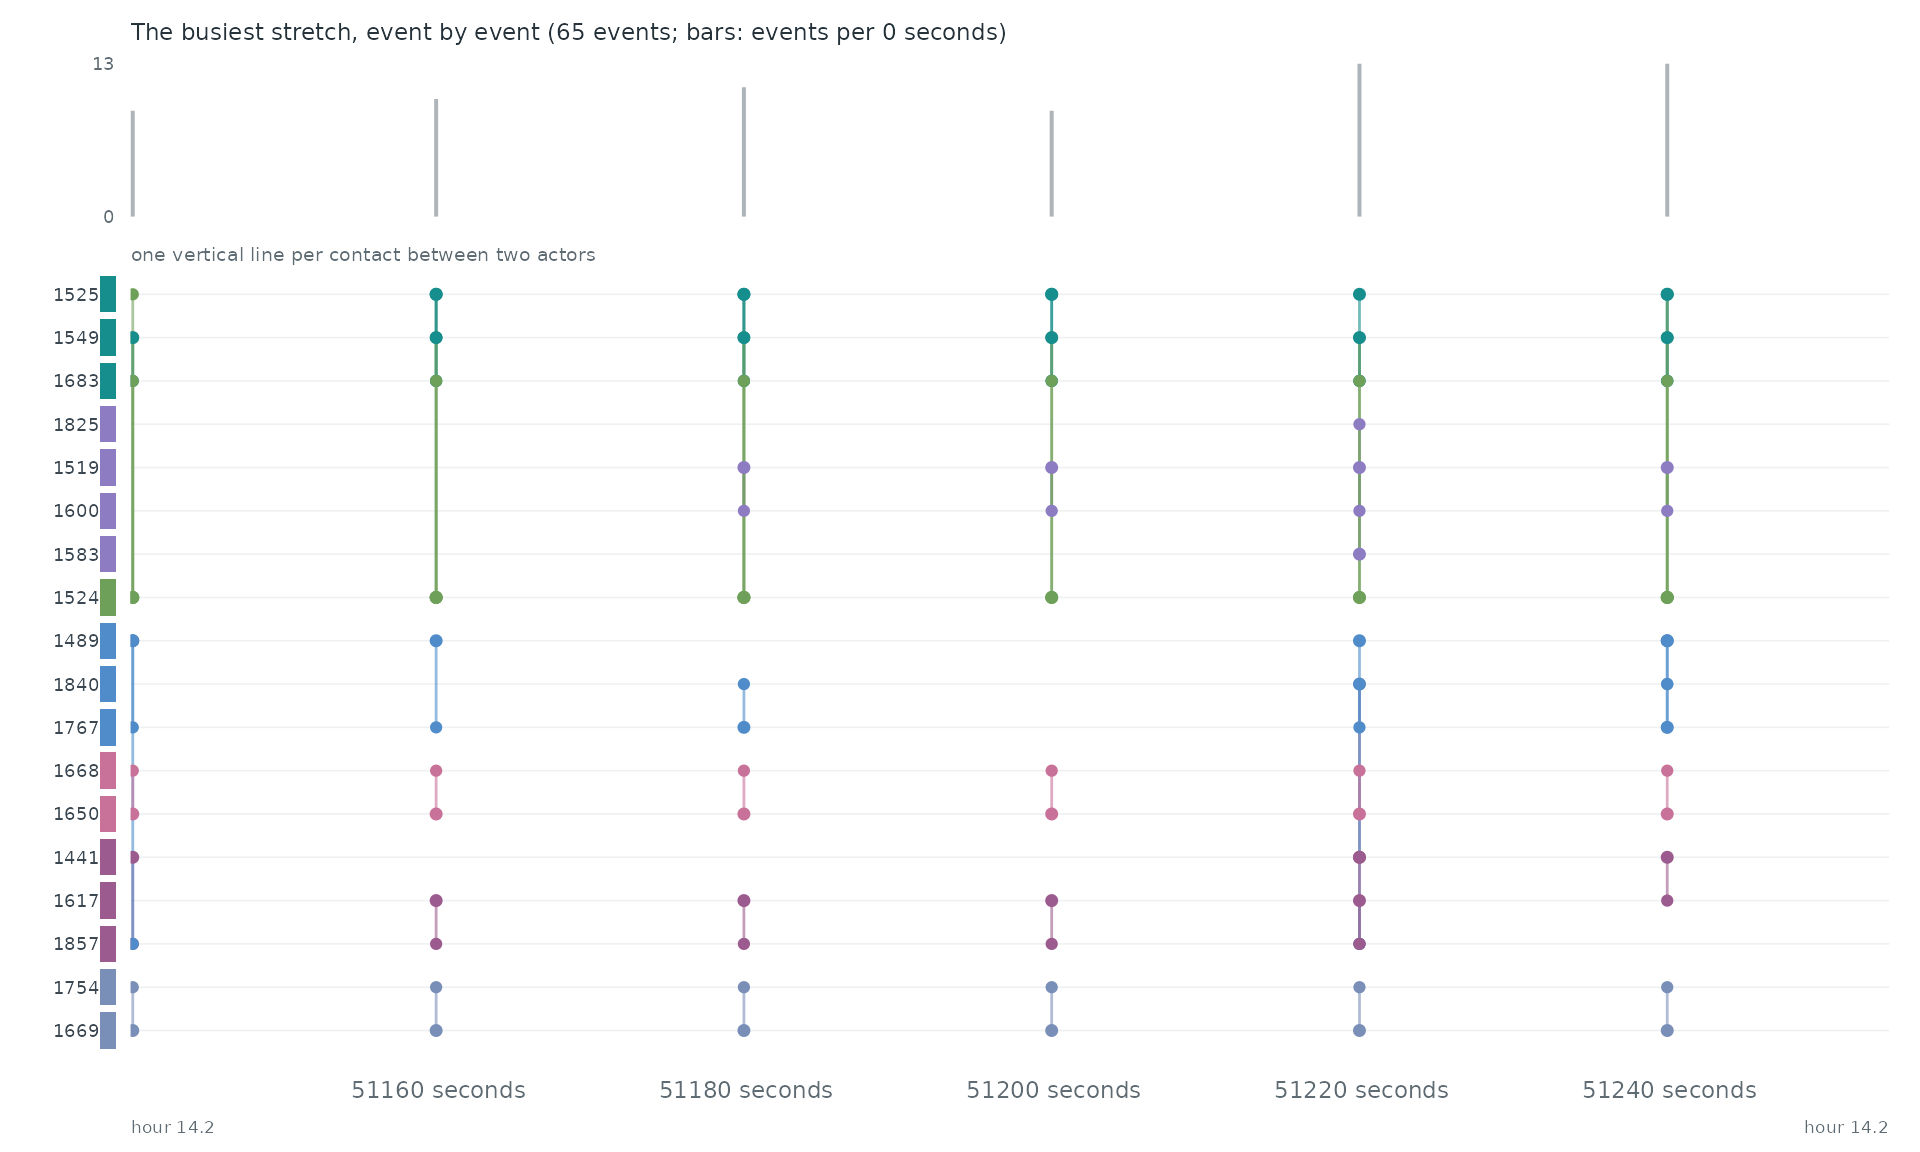
Event by event. The busiest stretch of the record, hour 14.2 to hour 14.2, event by event: each vertical line is one event between two of the actors above.
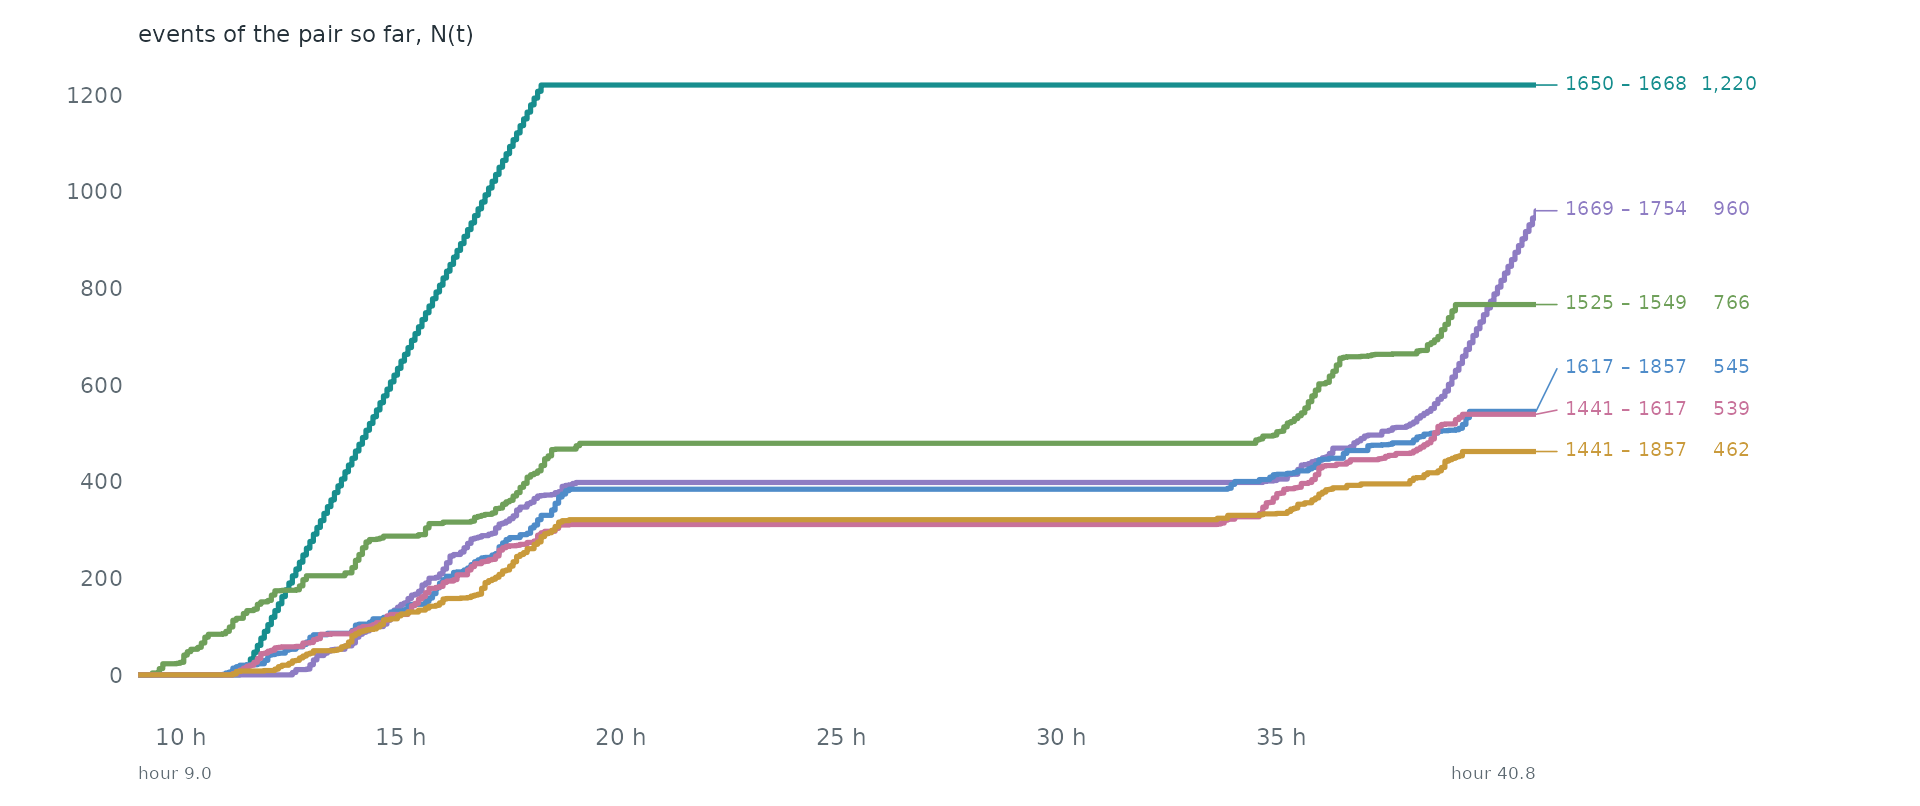
Pairs as counting processes. The counting process N(t) of the 6 busiest pairs: the number of events of the pair up to time t. Together they make 6.4% of all events. Steep stretches are bursts and flat ones silences.
Over time. day 1, 09:00 from start to day 1, 21:30 from start in windows of one 10 minutes (45,776 events in this span). Press play, or drag the bar to stop on a moment; the dark bar below the network marks the current window among all windows.
Statistical profile.
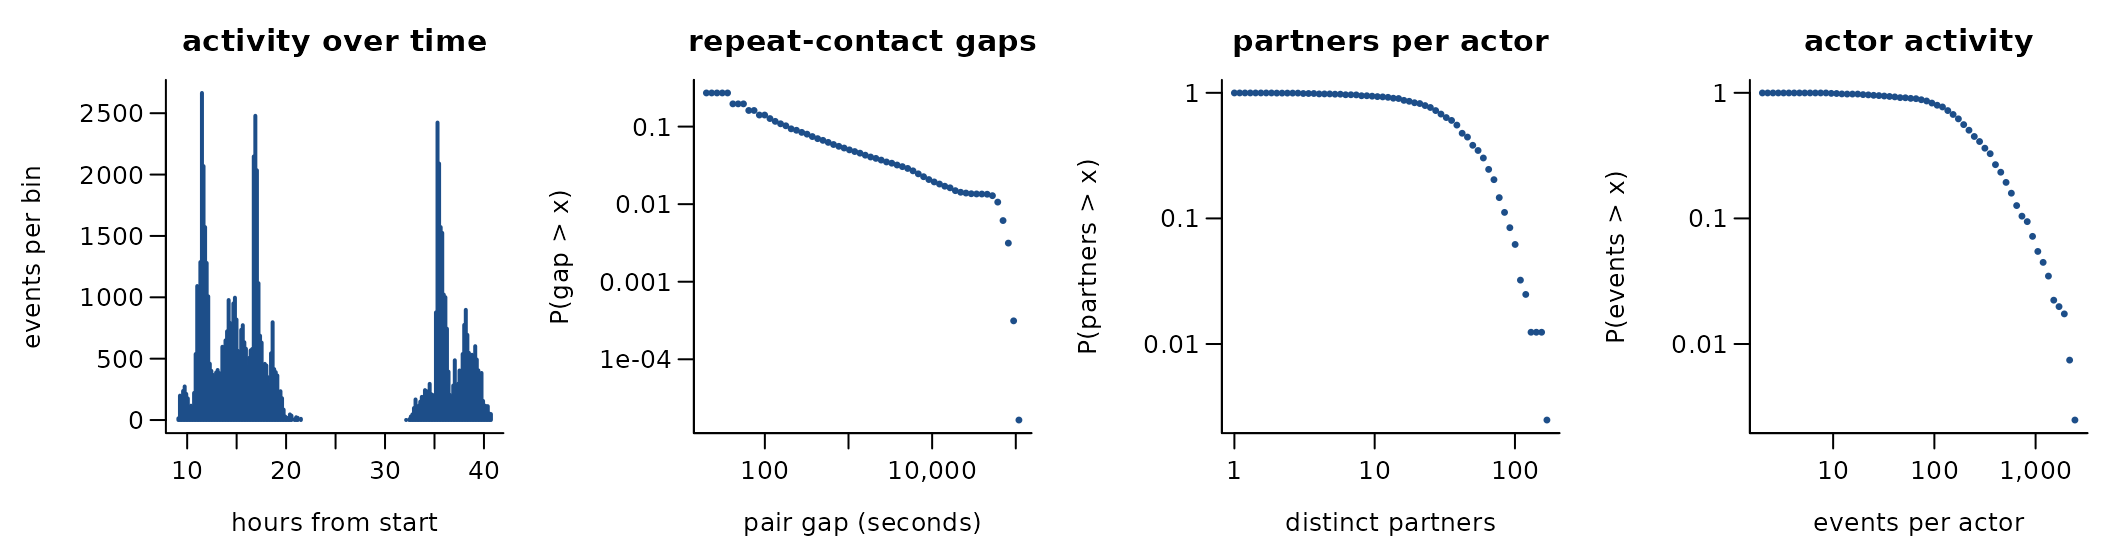
70,261 undirected contacts among 403 actors over 1.3 days (9,565 distinct pairs). 86.4% of events repeat an earlier pair; if every event chose a pair at random the share would be 33.1%. The burstiness coefficient of the gaps between successive events of the same pair is 0.75 (0 for a Poisson process, positive when events cluster in bursts); the most active tenth of the actors take part in 36.7% of events (Gini 0.49). 95.0% of events share their time stamp with an earlier one. time is seconds from an unstated origin
Get the data
download.file("https://sociopatterns.org/assets/data/SFHH_tij.dat.gz", "SFHH_tij.dat.gz", mode = "wb")A reader that turns these files into a
(sender, receiver, time) table is
readers[["sp-sfhh-conference"]] in data-raw/catalogue/readers.R.
SocioPatterns: Infectious exhibition contacts (Dublin)
Source: https://www.sociopatterns.org/datasets/high-school-contact-and-friendship-networks/ · Licence: CC BY-NC-SA · Status in amorem: non-commercial: not redistributable in amorem (MIT); obtain from the source.
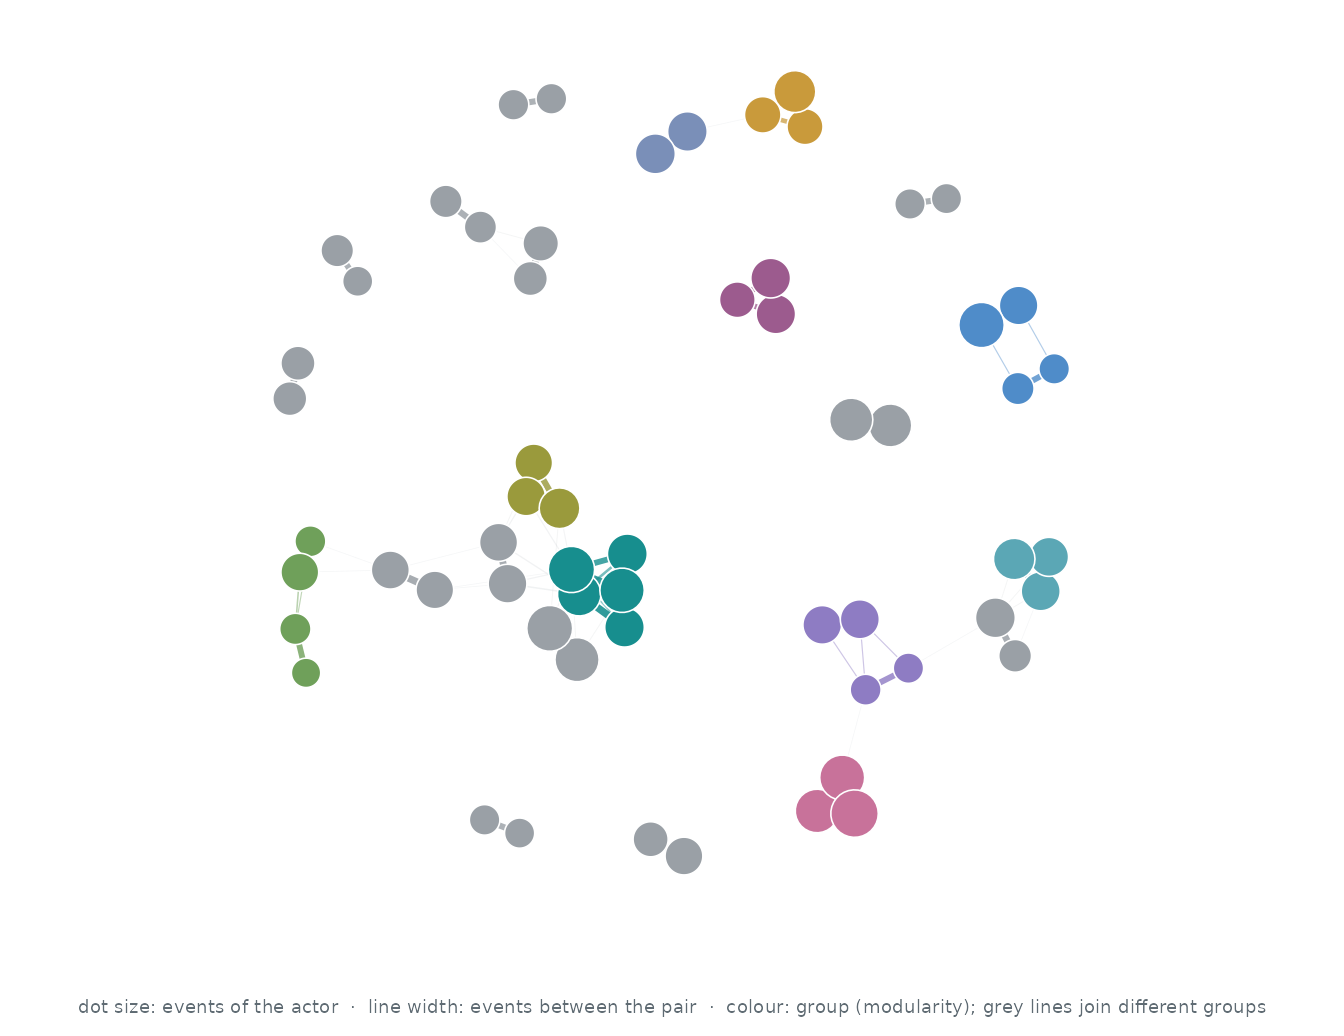
Who interacts with whom. The 60 actors of the busiest pairs, out of 200; events between two of them are 41.0% of all events. Each actor’s three strongest ties are drawn (76 of 100 pairs that ever interacted): wider, darker lines carry more events, larger dots are more active actors, and colours are groups found by modularity (Louvain).
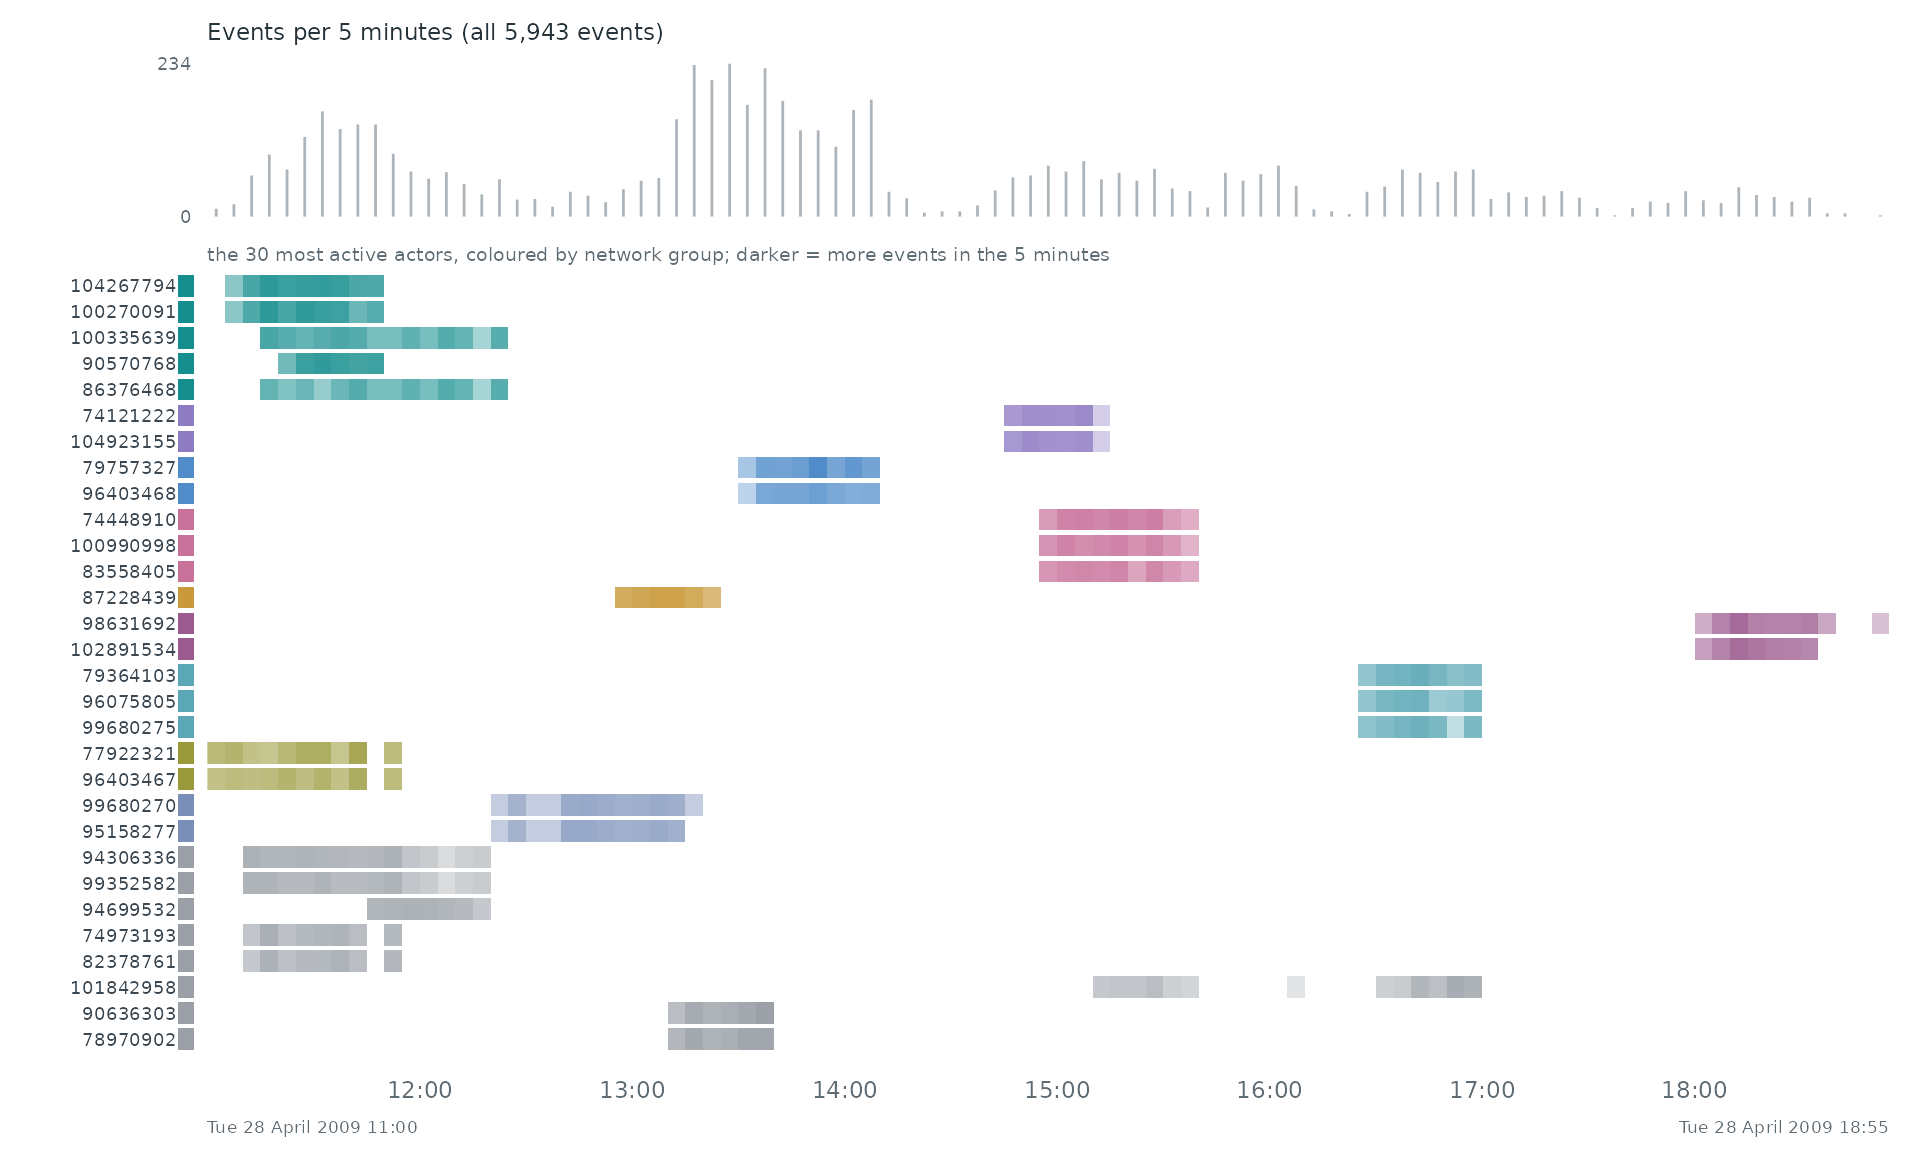
When. Each row is one of the 30 most active actors of the network, coloured by its group there; a cell is darker the more events (with anyone) the actor took part in during that stretch of time. The grey bars on top count all 5,943 events.
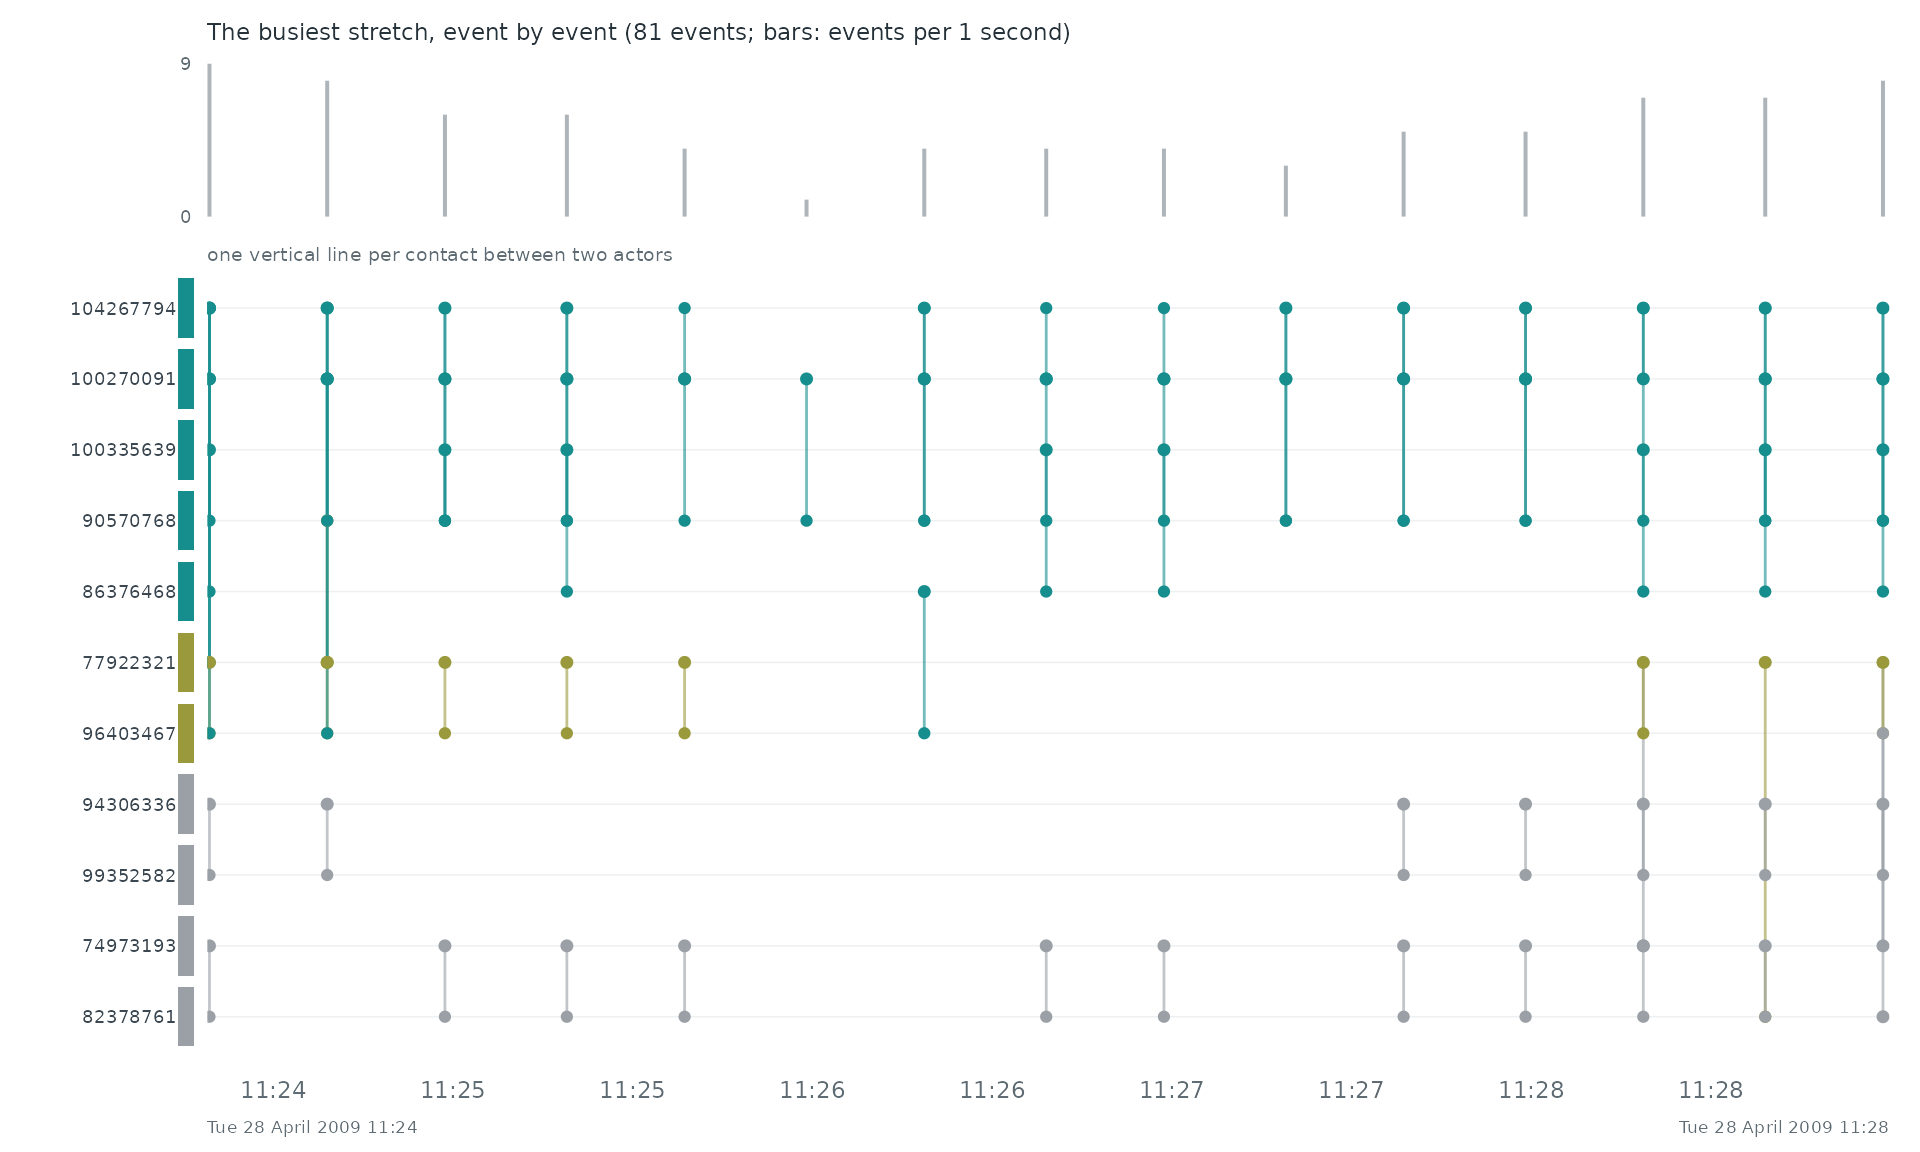
Event by event. The busiest stretch of the record, Tue 28 April 2009 11:24 to Tue 28 April 2009 11:28, event by event: each vertical line is one event between two of the actors above.
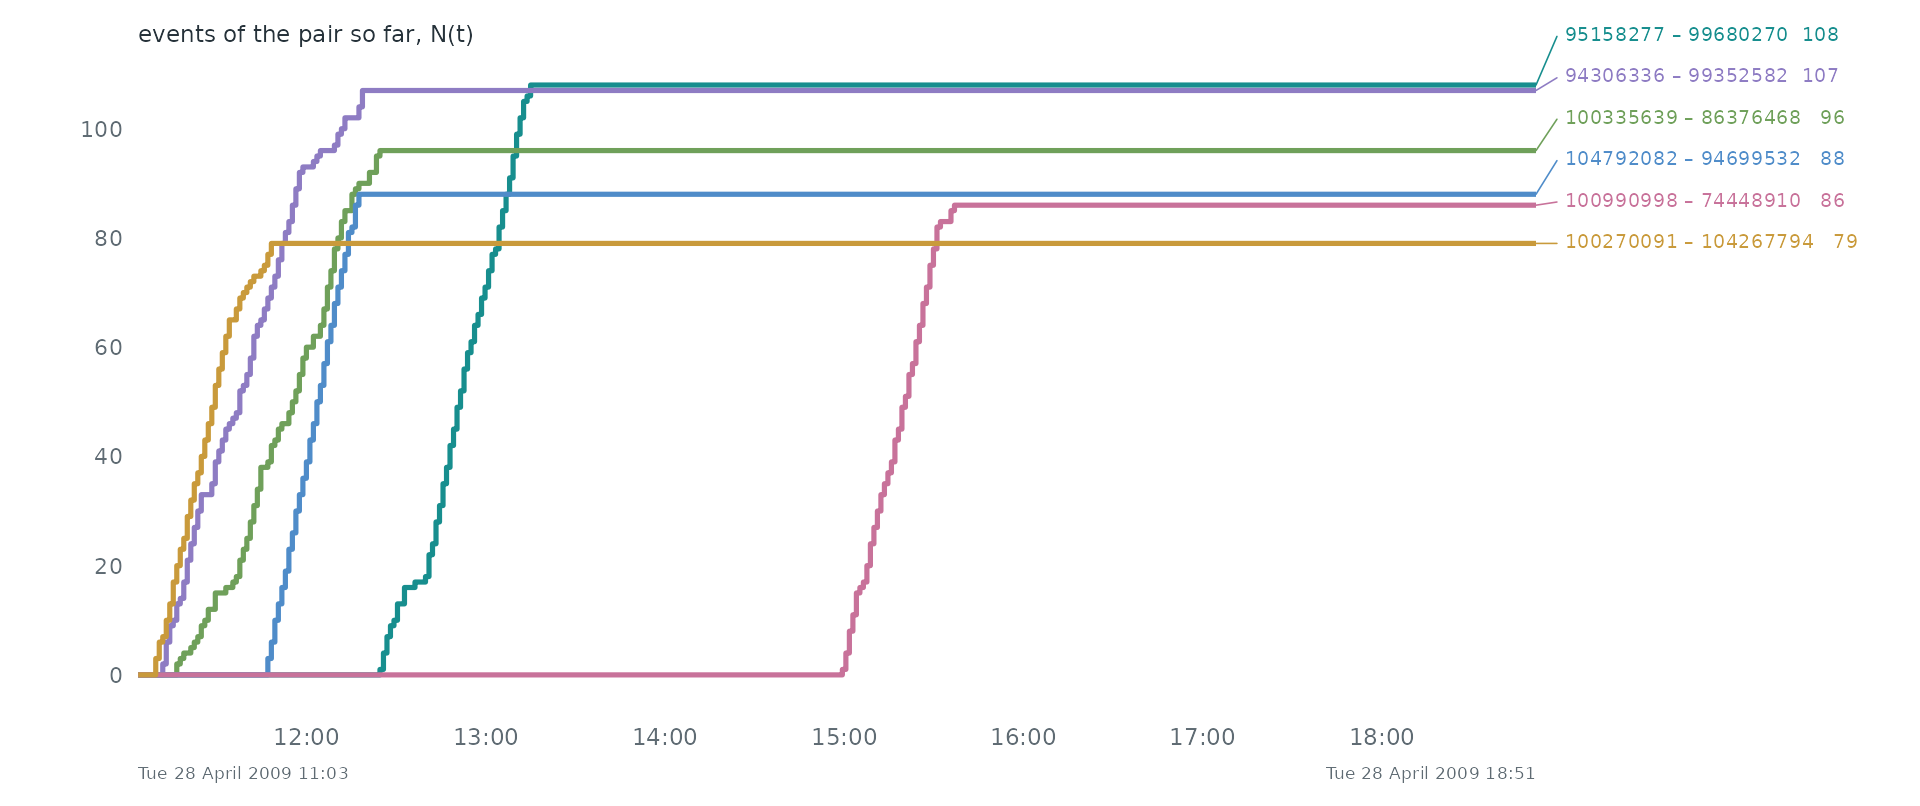
Pairs as counting processes. The counting process N(t) of the 6 busiest pairs: the number of events of the pair up to time t. Together they make 9.5% of all events. Steep stretches are bursts and flat ones silences.
Statistical profile.
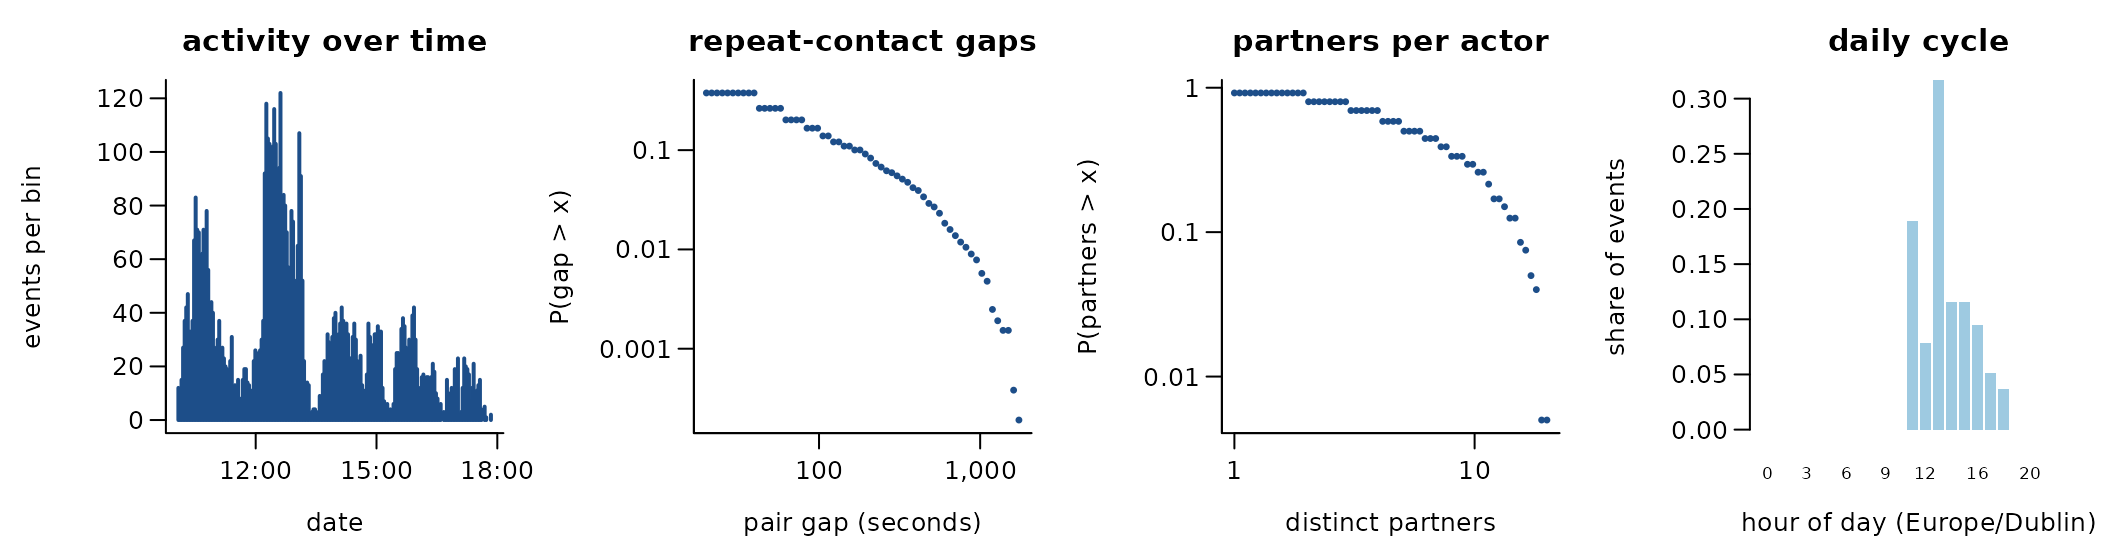
5,943 undirected contacts among 200 actors over 0.3 days (714 distinct pairs). 88.0% of events repeat an earlier pair; if every event chose a pair at random the share would be 13.5%. The burstiness coefficient of the gaps between successive events of the same pair is 0.34 (0 for a Poisson process, positive when events cluster in bursts); the most active tenth of the actors take part in 25.3% of events (Gini 0.41). 79.2% of events share their time stamp with an earlier one. one day of the 69 daily files: listcontacts_2009_04_28.txt
Get the data
download.file("https://sociopatterns.org/assets/data/sciencegallery_infectious_contacts.tgz", "sciencegallery_infectious_contacts.tgz", mode = "wb")A reader that turns these files into a
(sender, receiver, time) table is
readers[["sp-infectious-dublin"]] in data-raw/catalogue/readers.R.
SocioPatterns: village contacts in rural Malawi
Source: https://www.sociopatterns.org/datasets/high-school-contact-and-friendship-networks/ · Licence: CC BY-NC-SA · Status in amorem: non-commercial: not redistributable in amorem (MIT); obtain from the source.
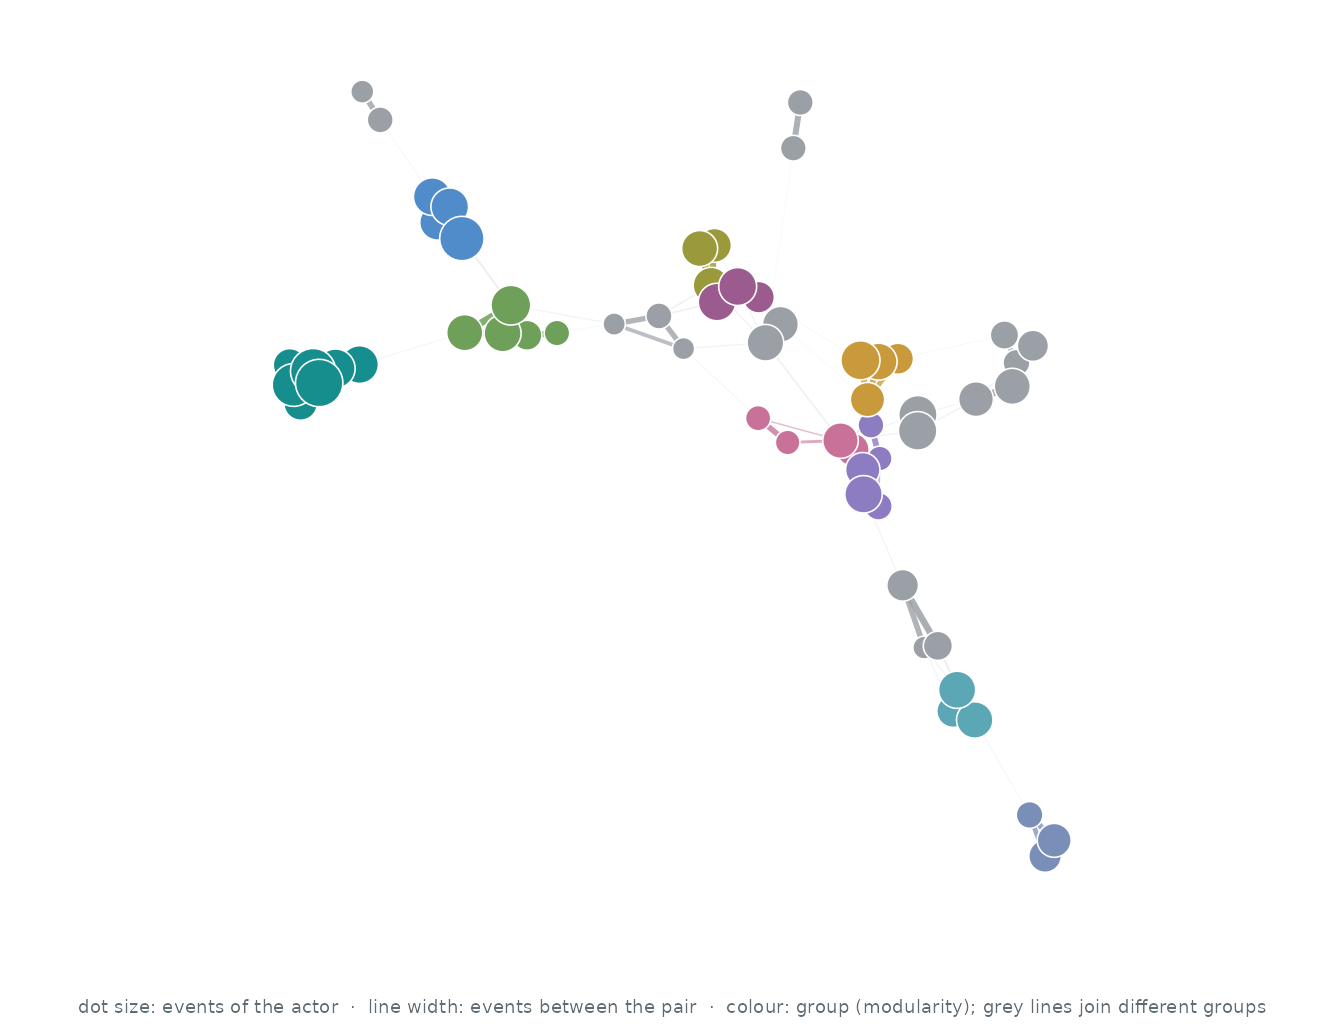
Who interacts with whom. The 60 actors of the busiest pairs, out of 86; events between two of them are 90.1% of all events. Each actor’s three strongest ties are drawn (108 of 219 pairs that ever interacted): wider, darker lines carry more events, larger dots are more active actors, and colours are groups found by modularity (Louvain).
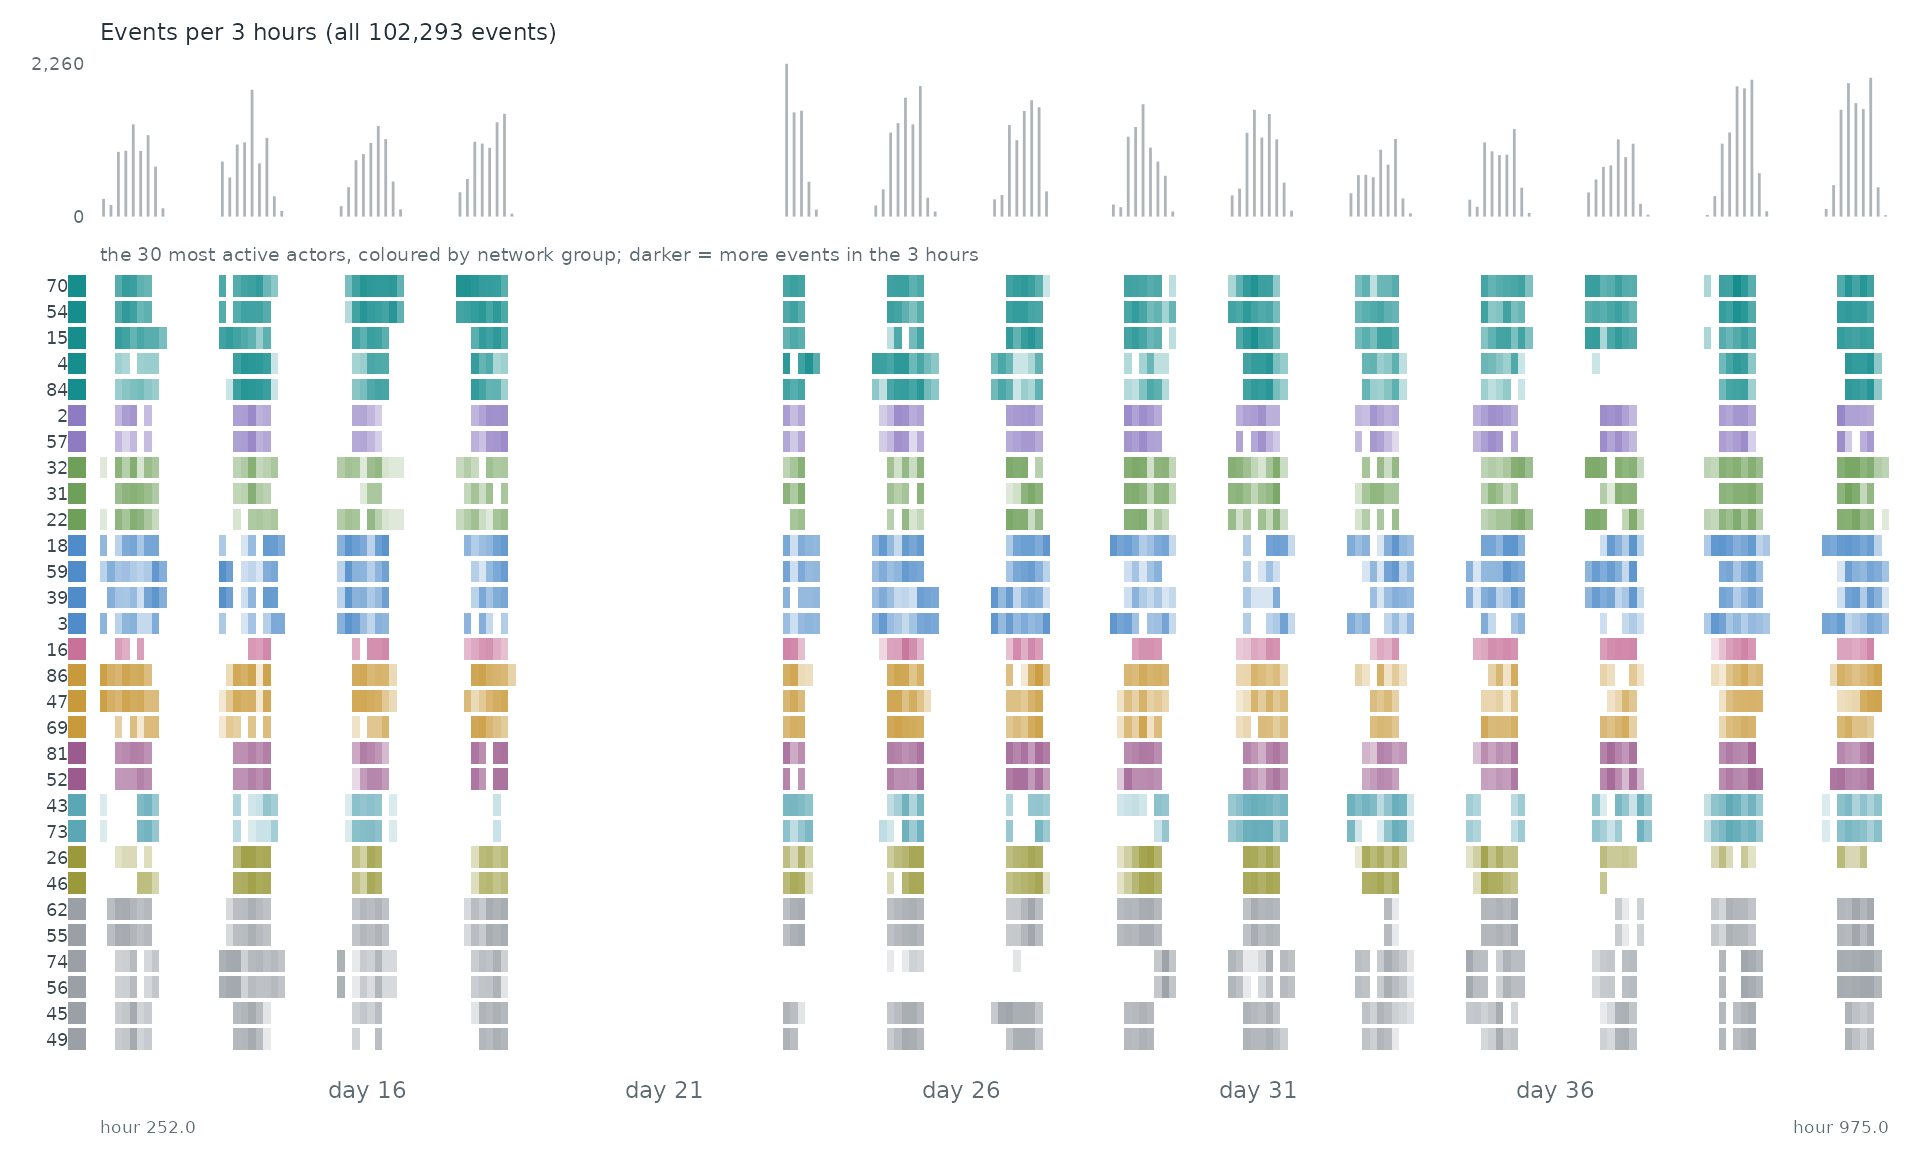
When. Each row is one of the 30 most active actors of the network, coloured by its group there; a cell is darker the more events (with anyone) the actor took part in during that stretch of time. The grey bars on top count all 102,293 events.
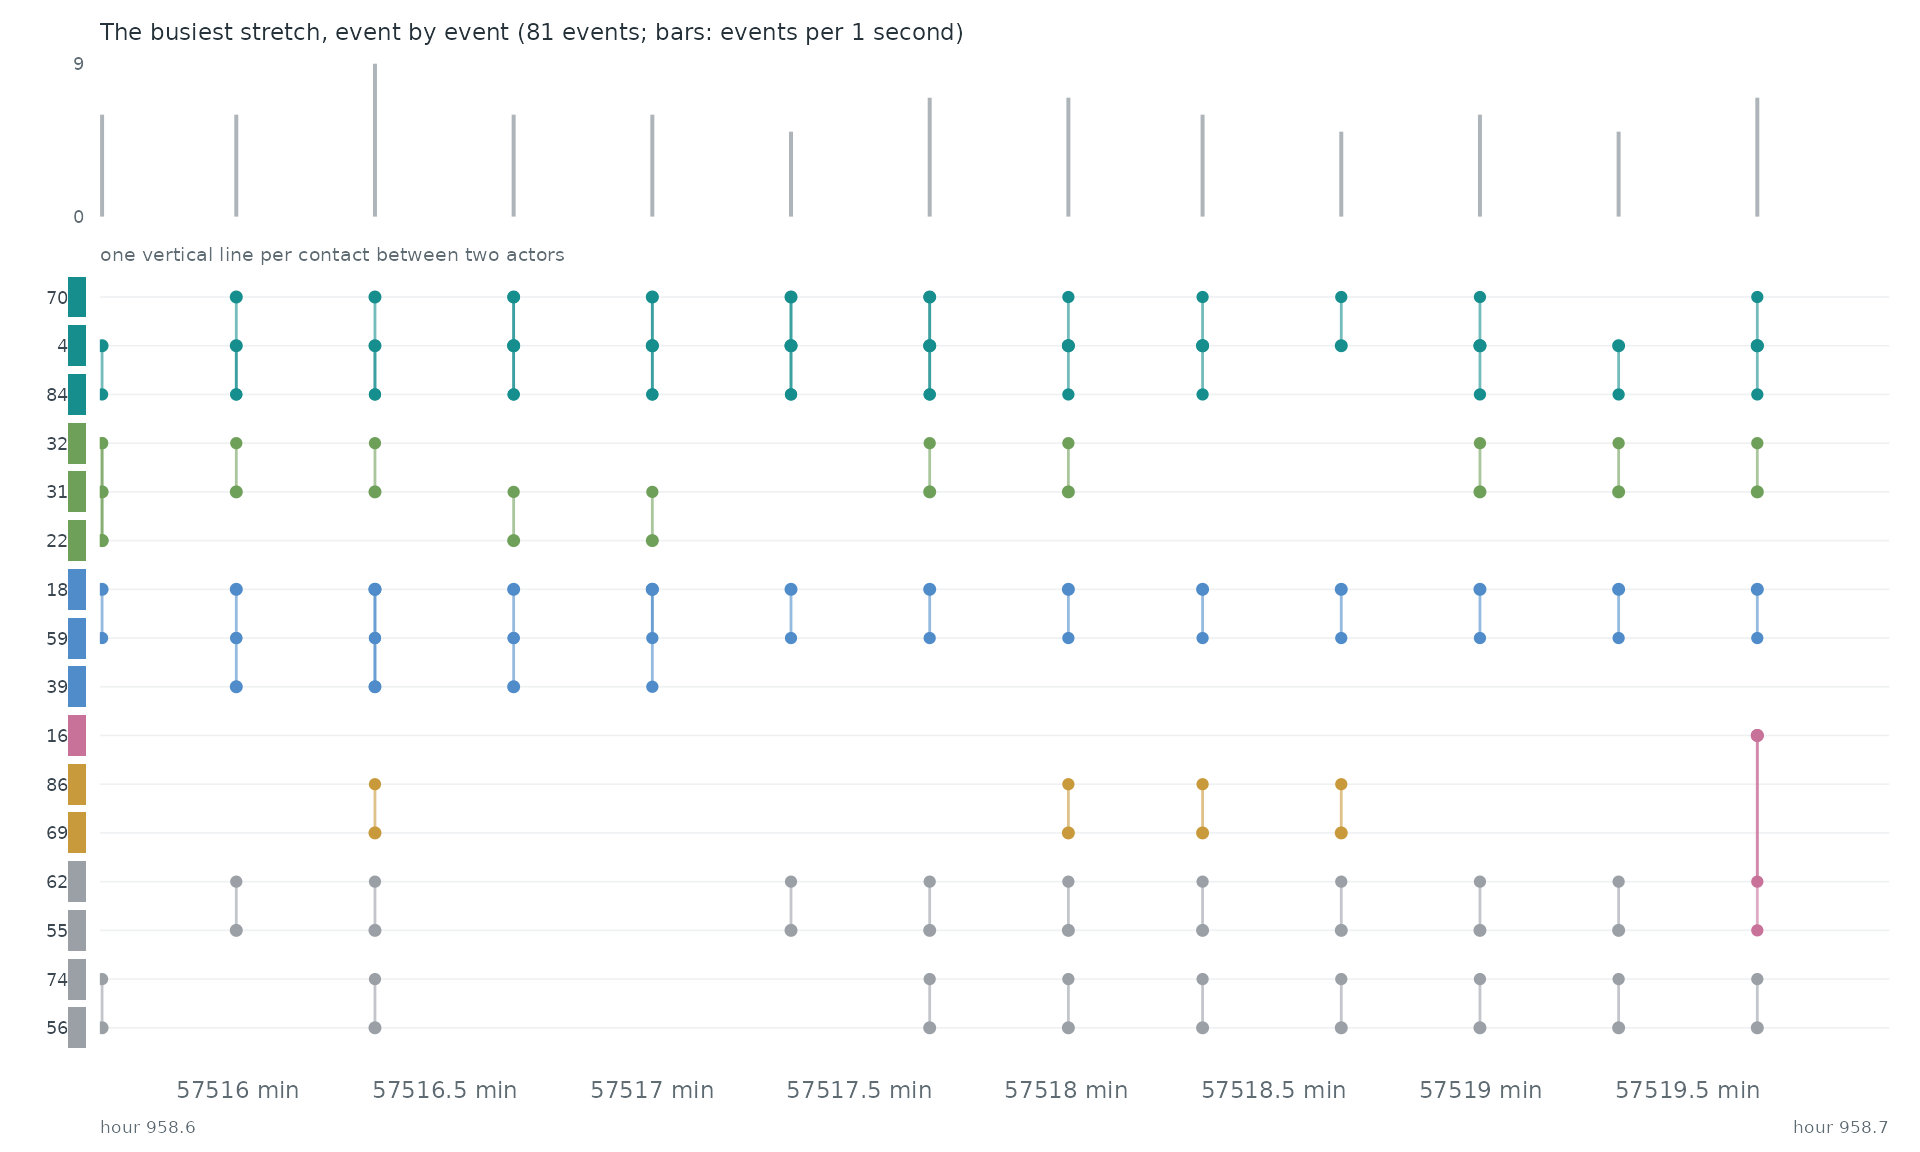
Event by event. The busiest stretch of the record, hour 958.6 to hour 958.7, event by event: each vertical line is one event between two of the actors above.
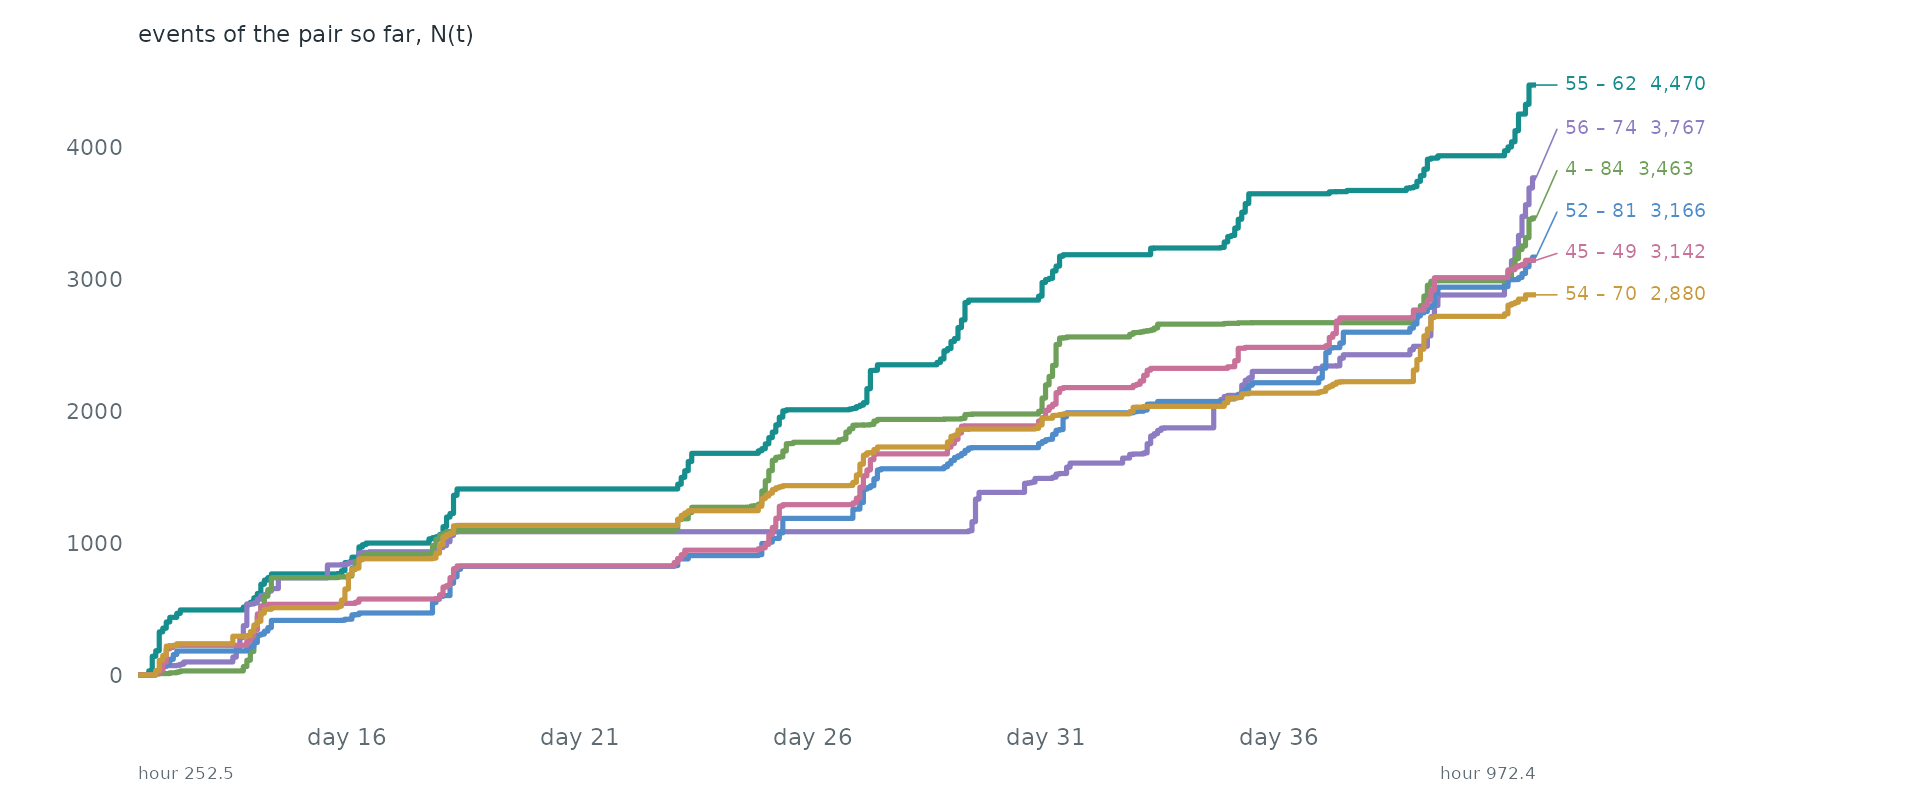
Pairs as counting processes. The counting process N(t) of the 6 busiest pairs: the number of events of the pair up to time t. Together they make 20.4% of all events. Steep stretches are bursts and flat ones silences.
Statistical profile.
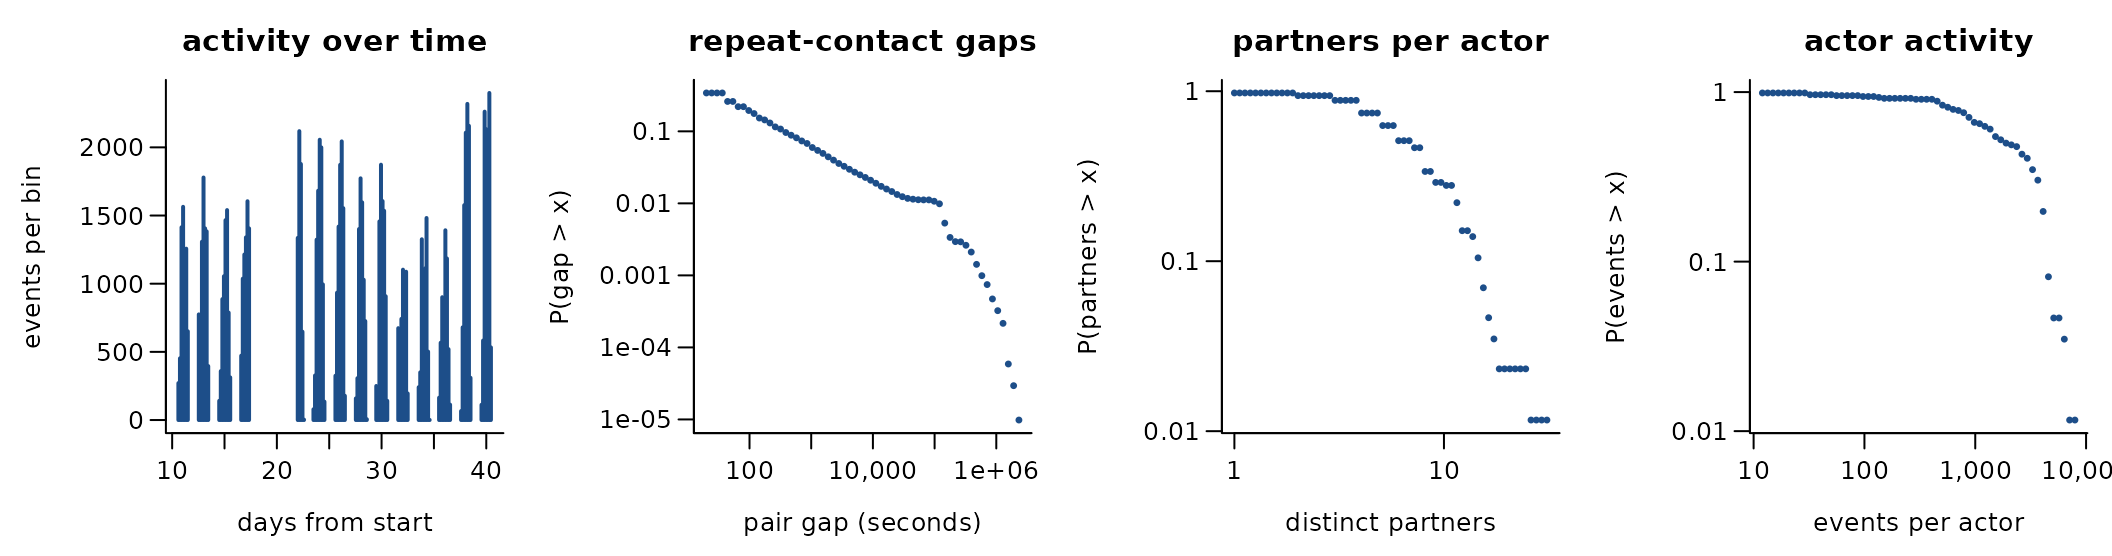
102,293 undirected contacts among 86 actors over 30.0 days (347 distinct pairs). 99.7% of events repeat an earlier pair; if every event chose a pair at random the share would be 96.4%. The burstiness coefficient of the gaps between successive events of the same pair is 0.85 (0 for a Poisson process, positive when events cluster in bursts); the most active tenth of the actors take part in 25.1% of events (Gini 0.43). 57.5% of events share their time stamp with an earlier one. time = day * 86400 + contact_time
Get the data
download.file("https://sociopatterns.org/assets/data/tnet_malawi_pilot.csv.gz", "tnet_malawi_pilot.csv.gz", mode = "wb")A reader that turns these files into a
(sender, receiver, time) table is
readers[["sp-malawi-village"]] in data-raw/catalogue/readers.R.
SocioPatterns: household contacts in rural Kenya
Source: https://www.sociopatterns.org/datasets/high-school-contact-and-friendship-networks/ · Licence: CC BY-NC-SA · Status in amorem: non-commercial: not redistributable in amorem (MIT); obtain from the source.
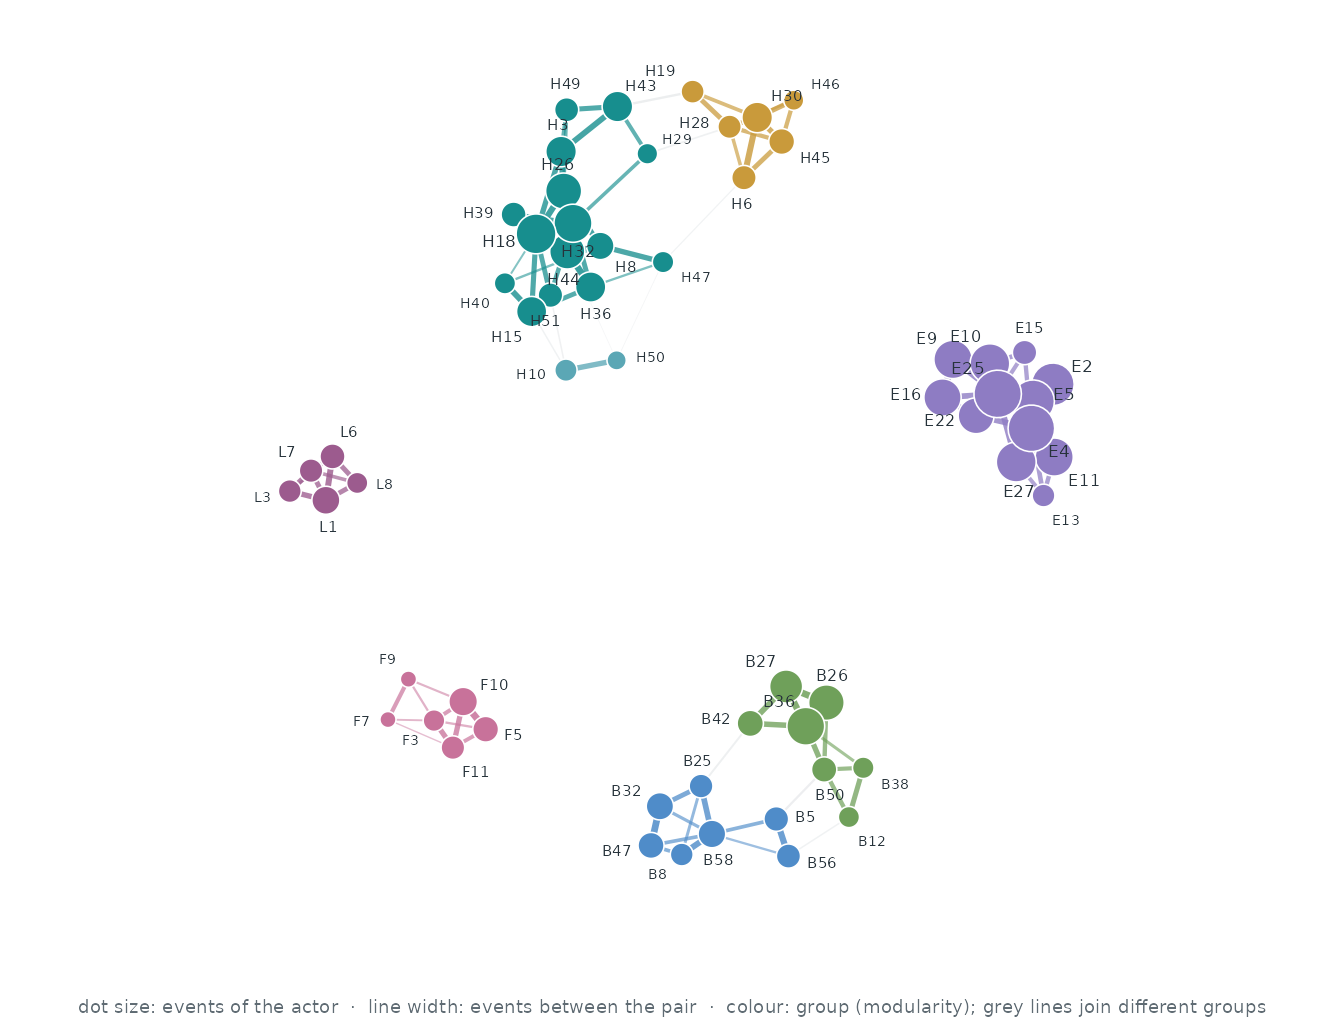
Who interacts with whom. The 60 actors of the busiest pairs, out of 75; events between two of them are 93.8% of all events. Each actor’s three strongest ties are drawn (120 of 345 pairs that ever interacted): wider, darker lines carry more events, larger dots are more active actors, and colours are groups found by modularity (Louvain).
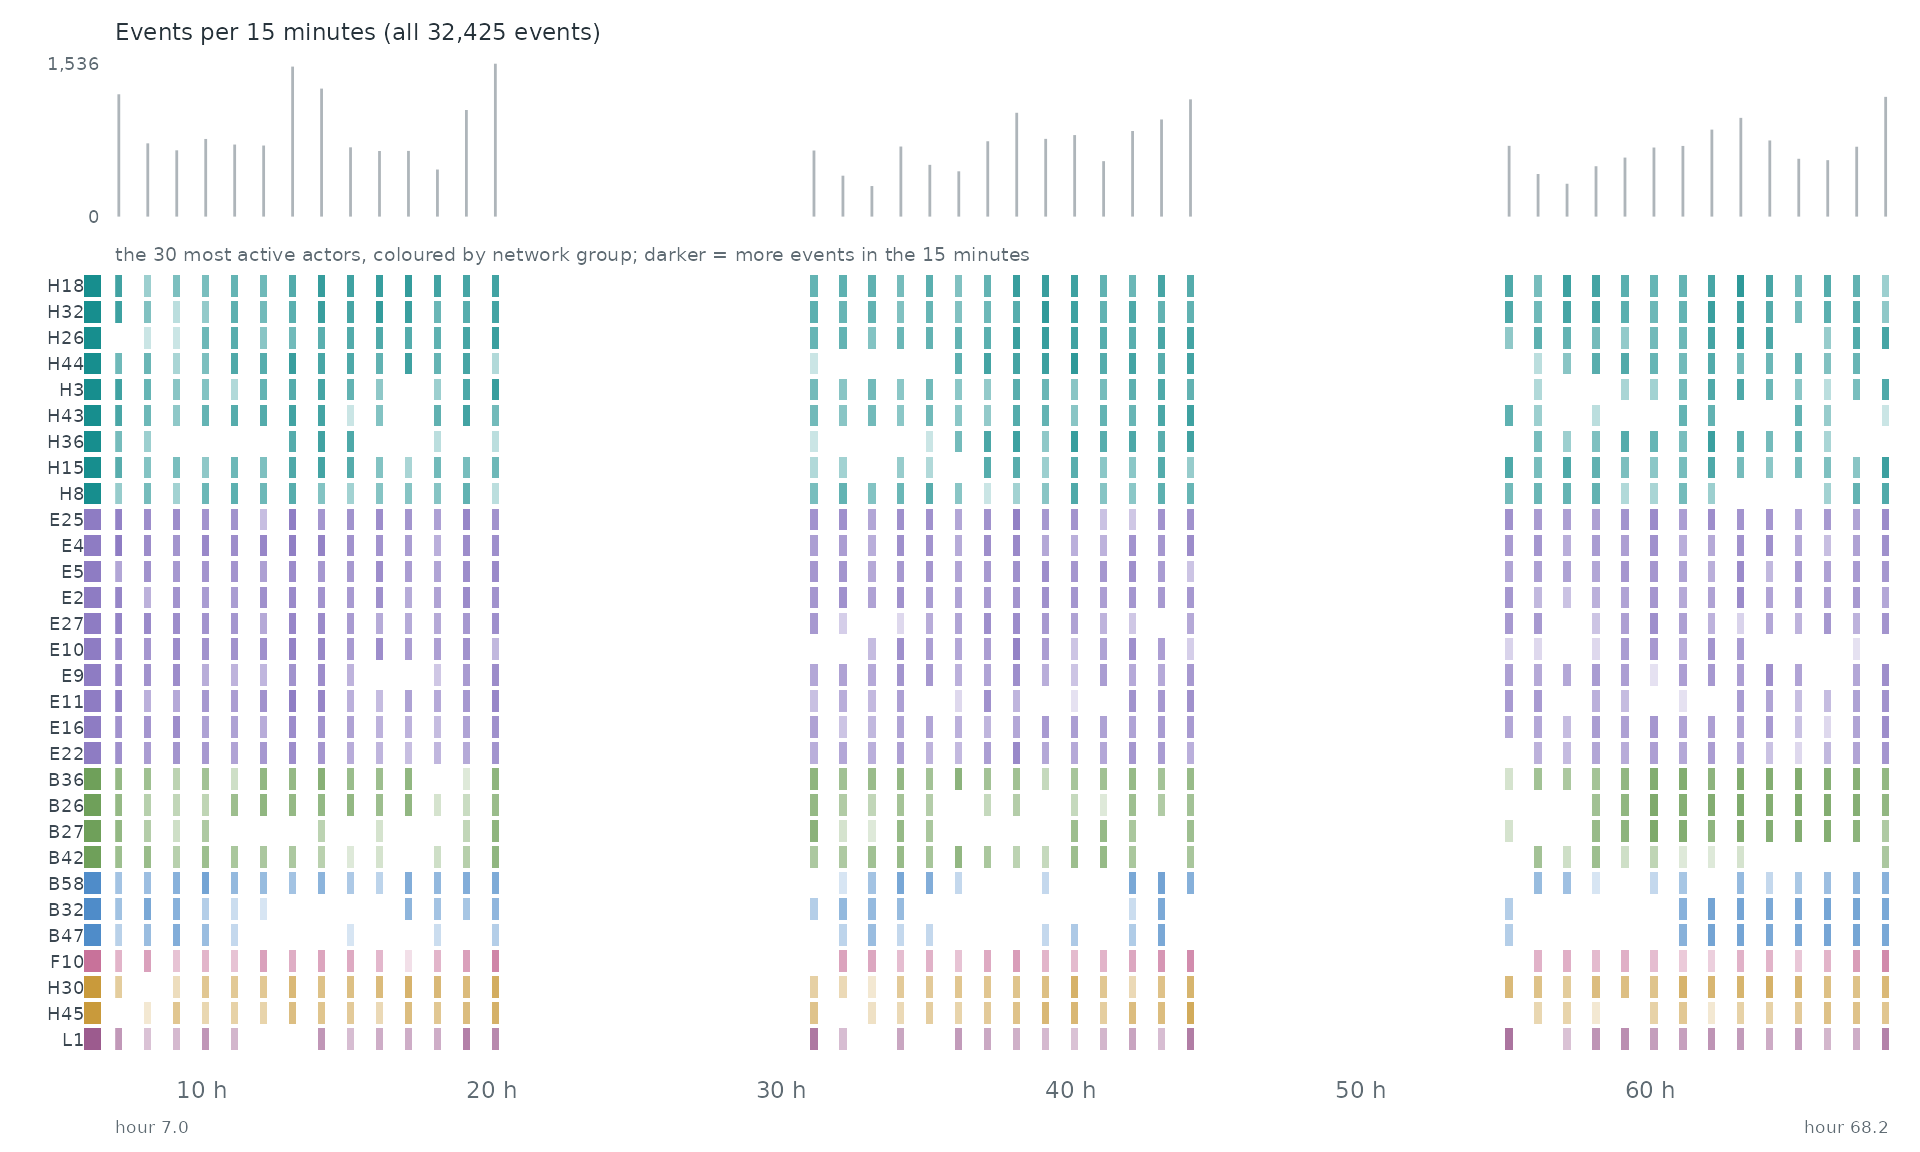
When. Each row is one of the 30 most active actors of the network, coloured by its group there; a cell is darker the more events (with anyone) the actor took part in during that stretch of time. The grey bars on top count all 32,425 events.
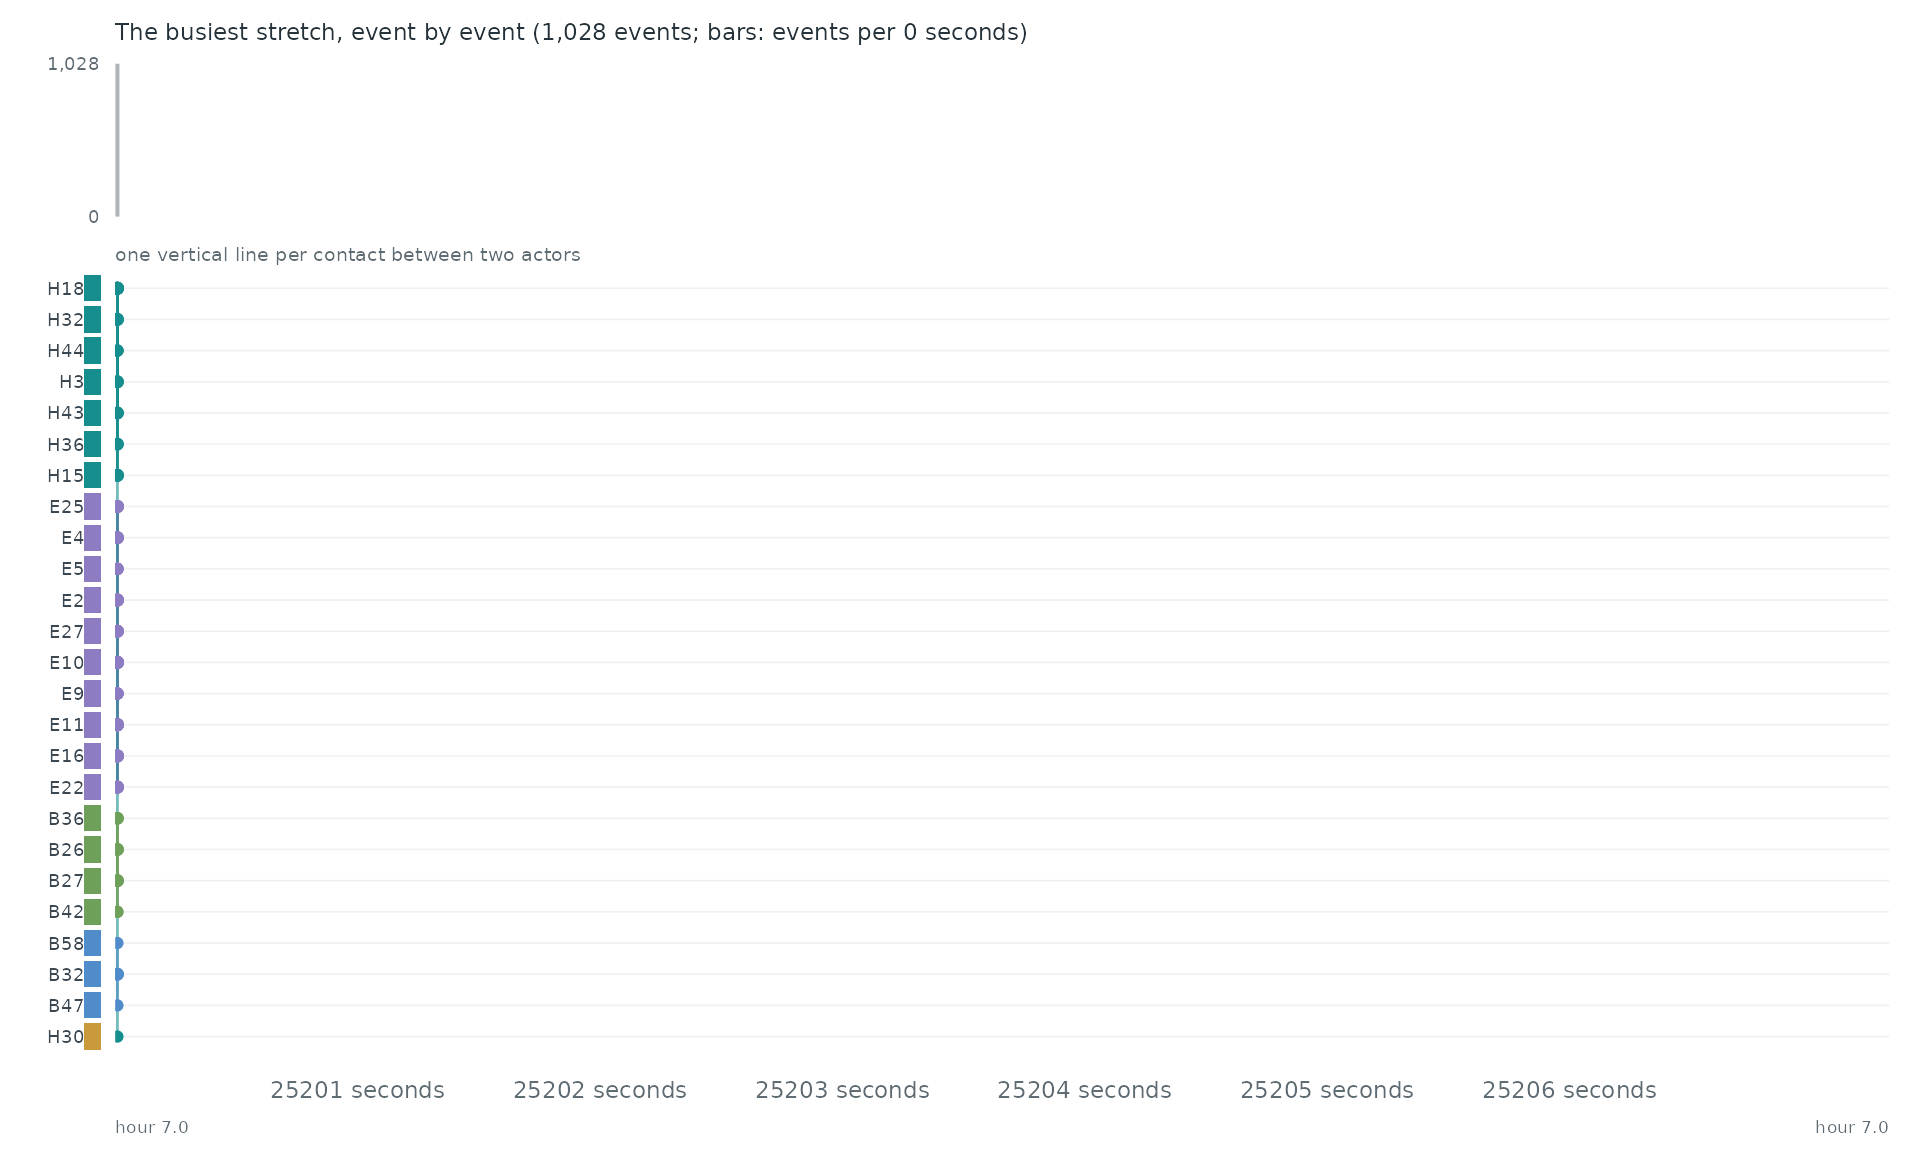
Event by event. The busiest stretch of the record, hour 7.0 to hour 7.0, event by event: each vertical line is one event between two of the actors above.
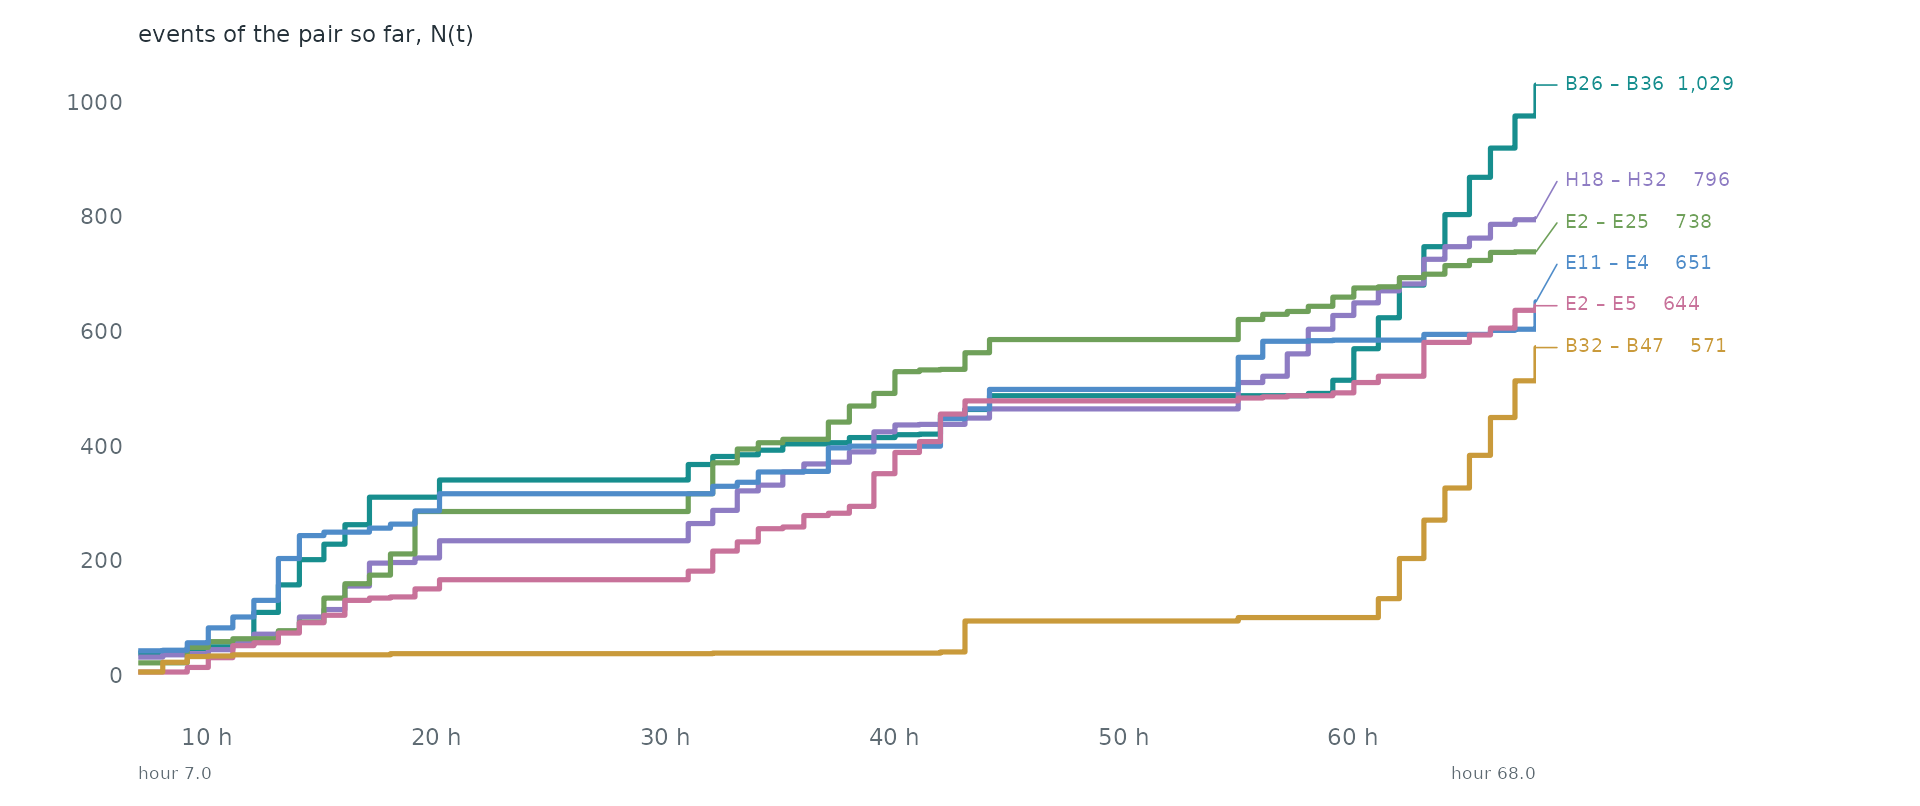
Pairs as counting processes. The counting process N(t) of the 6 busiest pairs: the number of events of the pair up to time t. Together they make 13.7% of all events. Steep stretches are bursts and flat ones silences.
Statistical profile.
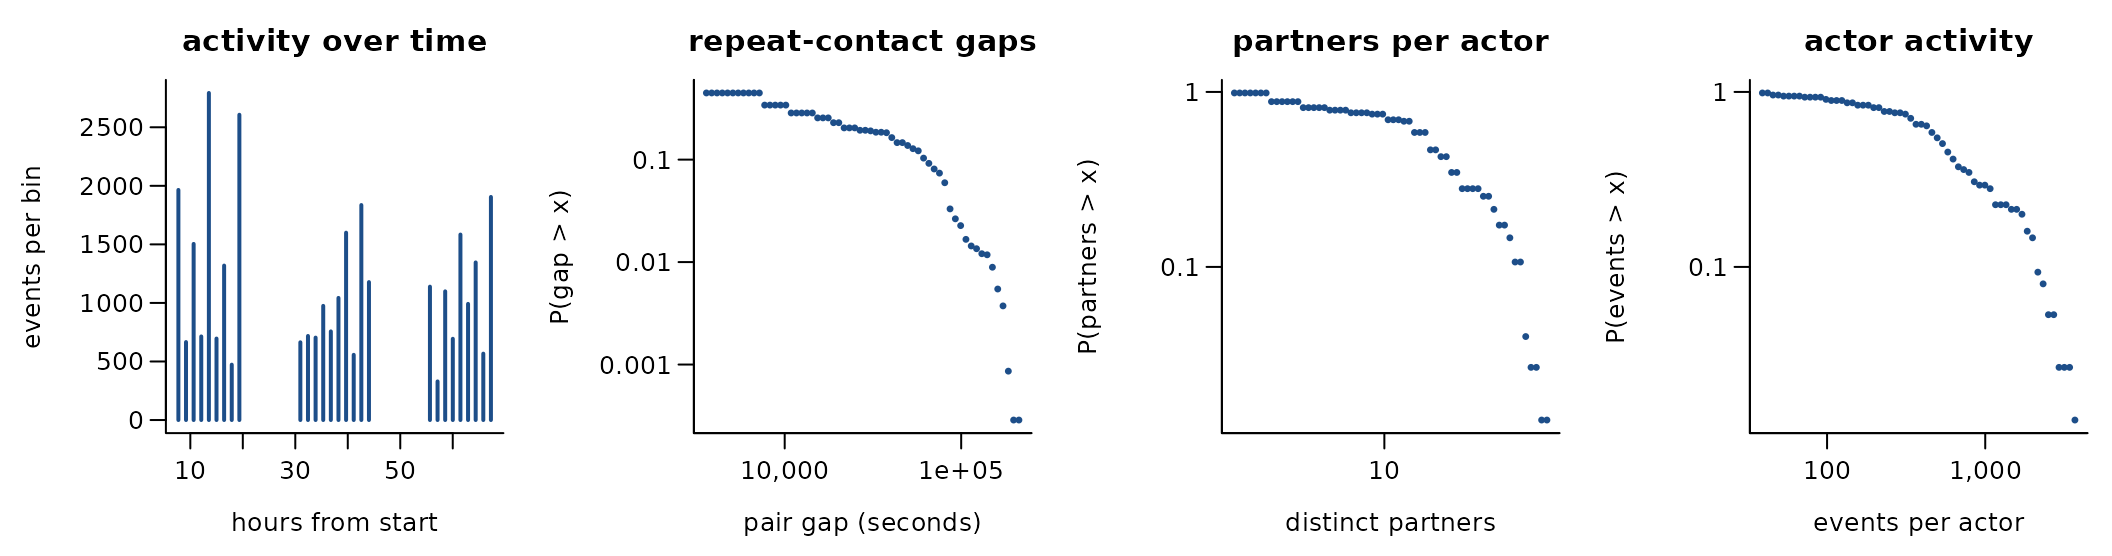
32,425 undirected contacts among 75 actors over 2.5 days (515 distinct pairs). 98.4% of events repeat an earlier pair; if every event chose a pair at random the share would be 91.4%. The burstiness coefficient of the gaps between successive events of the same pair is 0.22 (0 for a Poisson process, positive when events cluster in bursts); the most active tenth of the actors take part in 33.8% of events (Gini 0.50). 99.9% of events share their time stamp with an earlier one. hourly resolution: time = (day - 1) * 86400 + hour * 3600; one row per contact with duration
Get the data
download.file("https://sociopatterns.org/assets/data/scc2034_household_contact_dataset.zip", "scc2034_household_contact_dataset.zip", mode = "wb")
download.file("https://sociopatterns.org/assets/data/scc2034_variables_dictionary.txt", "scc2034_variables_dictionary.txt", mode = "wb")
A reader that turns these files into a
(sender, receiver, time) table is
readers[["sp-kenya-households"]] in data-raw/catalogue/readers.R.
SocioPatterns: baboon proximity and observations (Rousset)
Source: https://www.sociopatterns.org/datasets/high-school-contact-and-friendship-networks/ · Licence: CC BY-NC-SA · Status in amorem: non-commercial: not redistributable in amorem (MIT); obtain from the source.
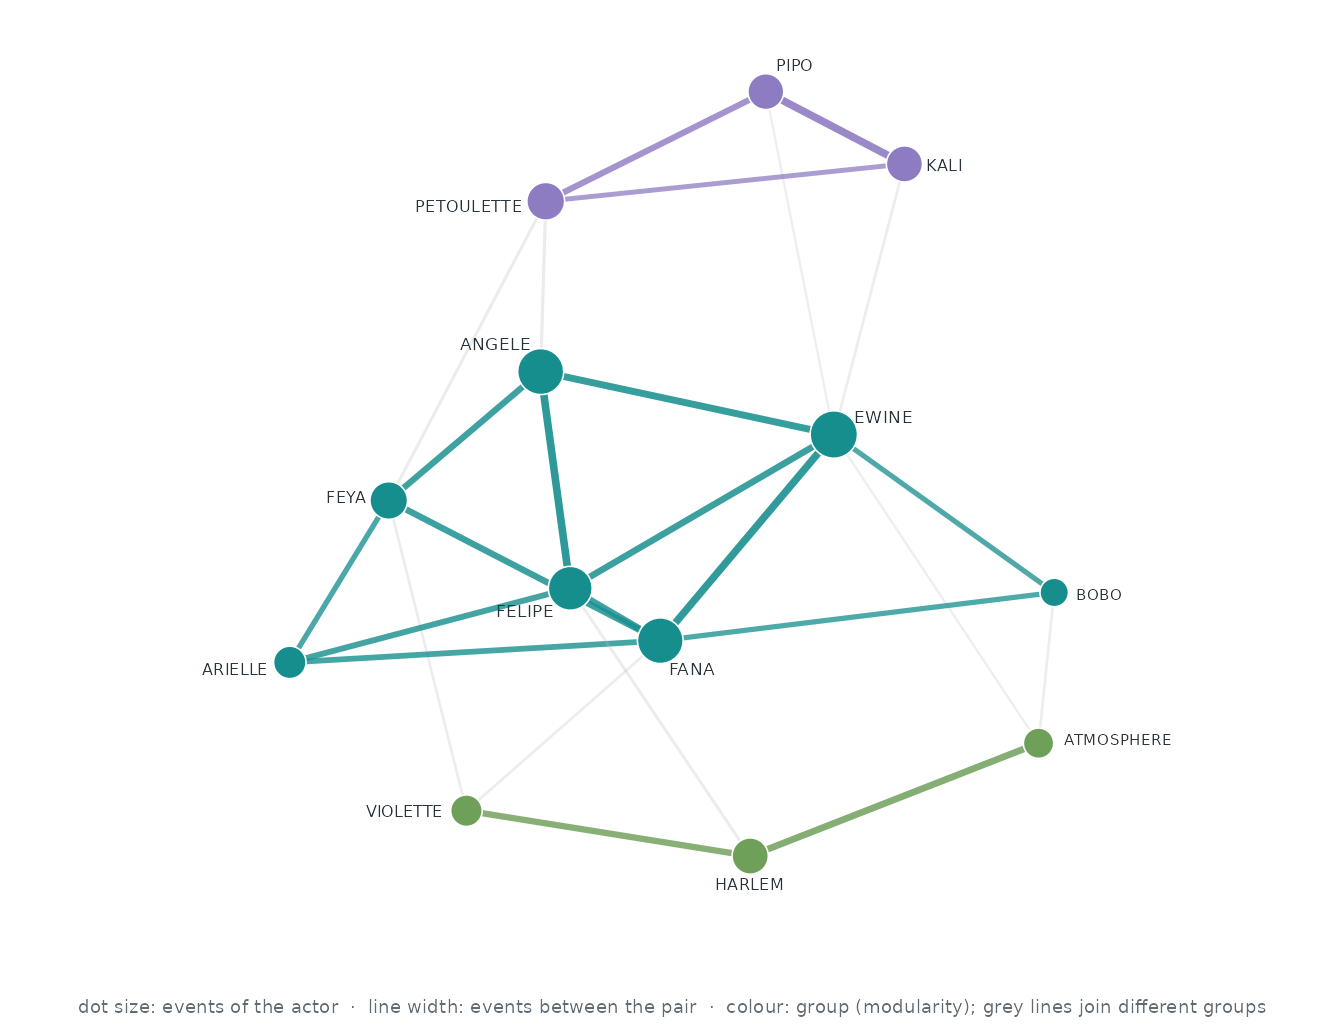
Who interacts with whom. The 13 actors of the busiest pairs, out of 13; events between two of them are 100.0% of all events. Each actor’s three strongest ties are drawn (26 of 78 pairs that ever interacted): wider, darker lines carry more events, larger dots are more active actors, and colours are groups found by modularity (Louvain).
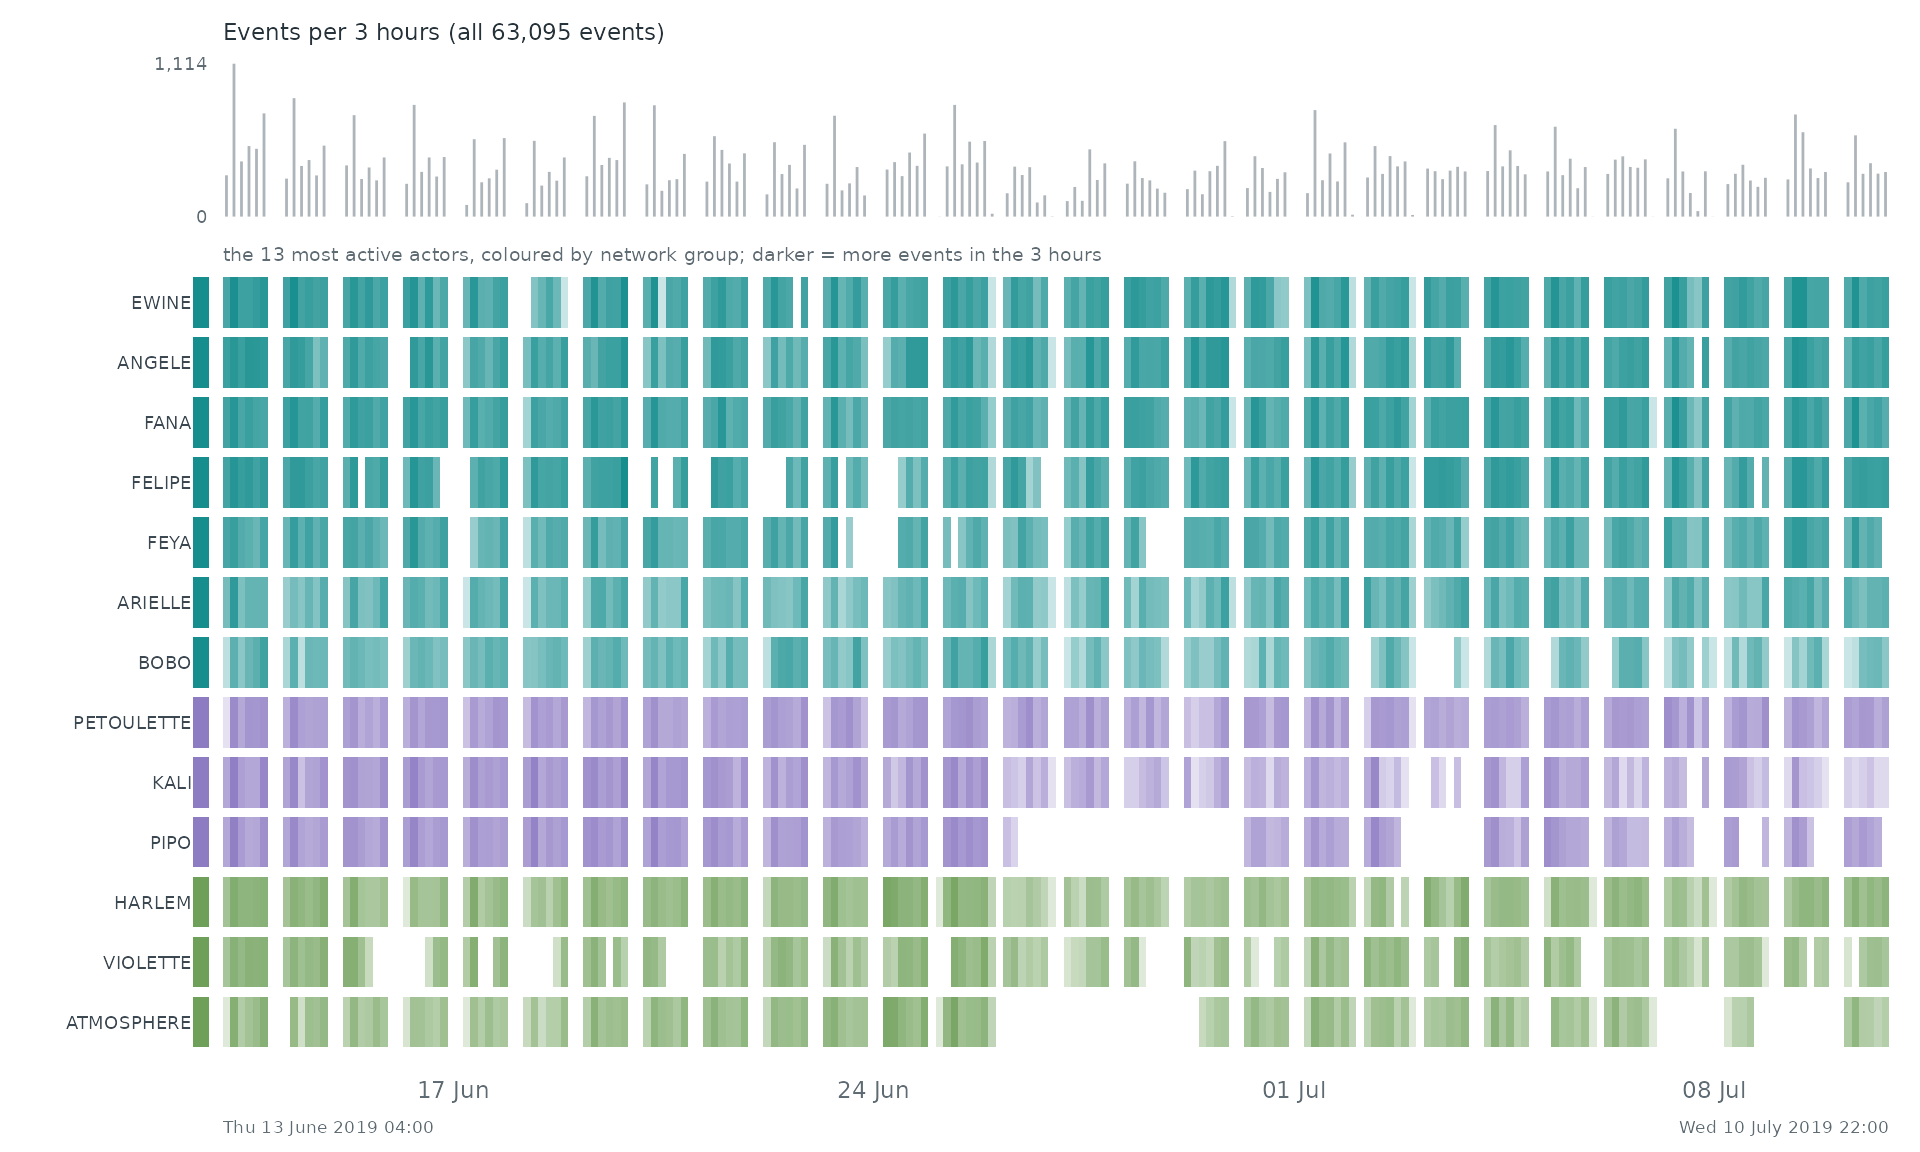
When. Each row is one of the 13 most active actors of the network, coloured by its group there; a cell is darker the more events (with anyone) the actor took part in during that stretch of time. The grey bars on top count all 63,095 events.
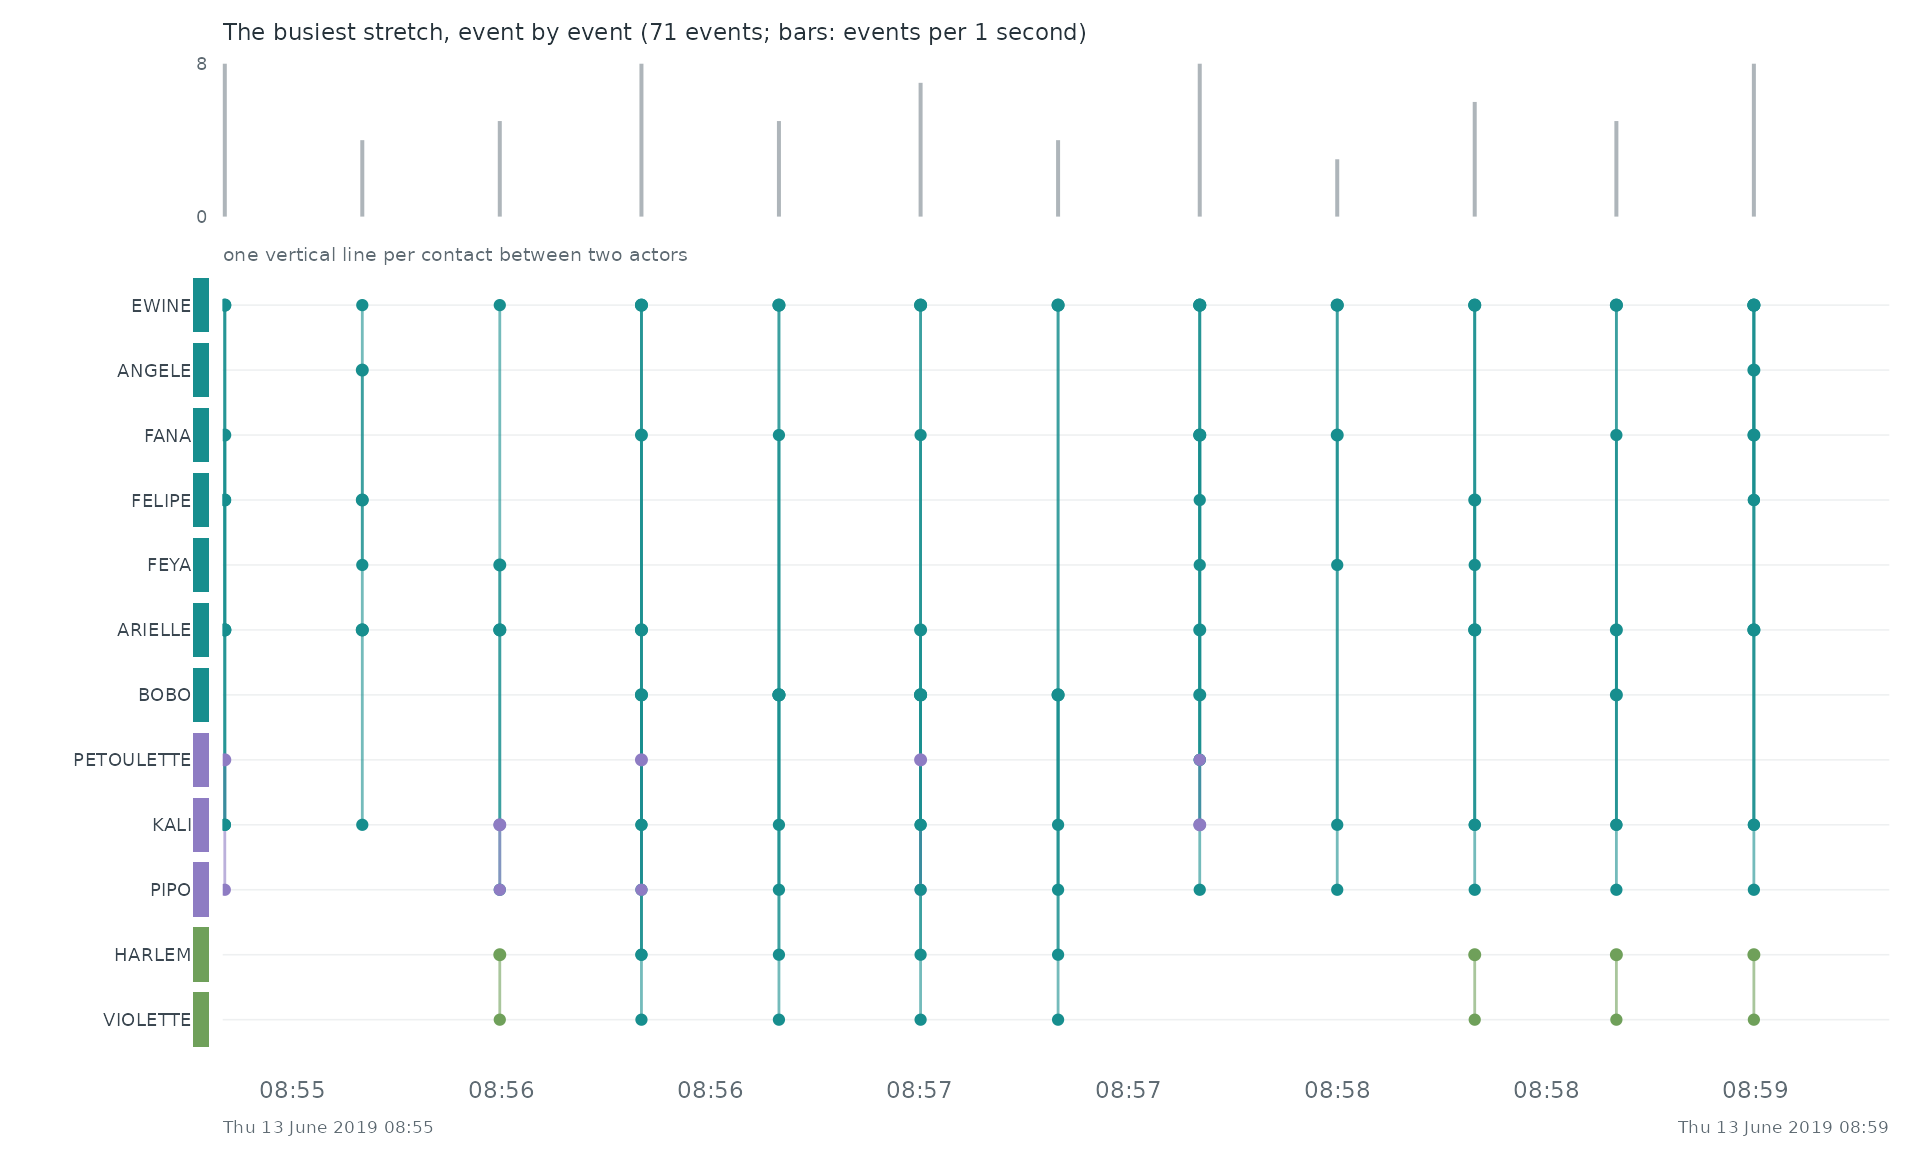
Event by event. The busiest stretch of the record, Thu 13 June 2019 08:55 to Thu 13 June 2019 08:59, event by event: each vertical line is one event between two of the actors above.
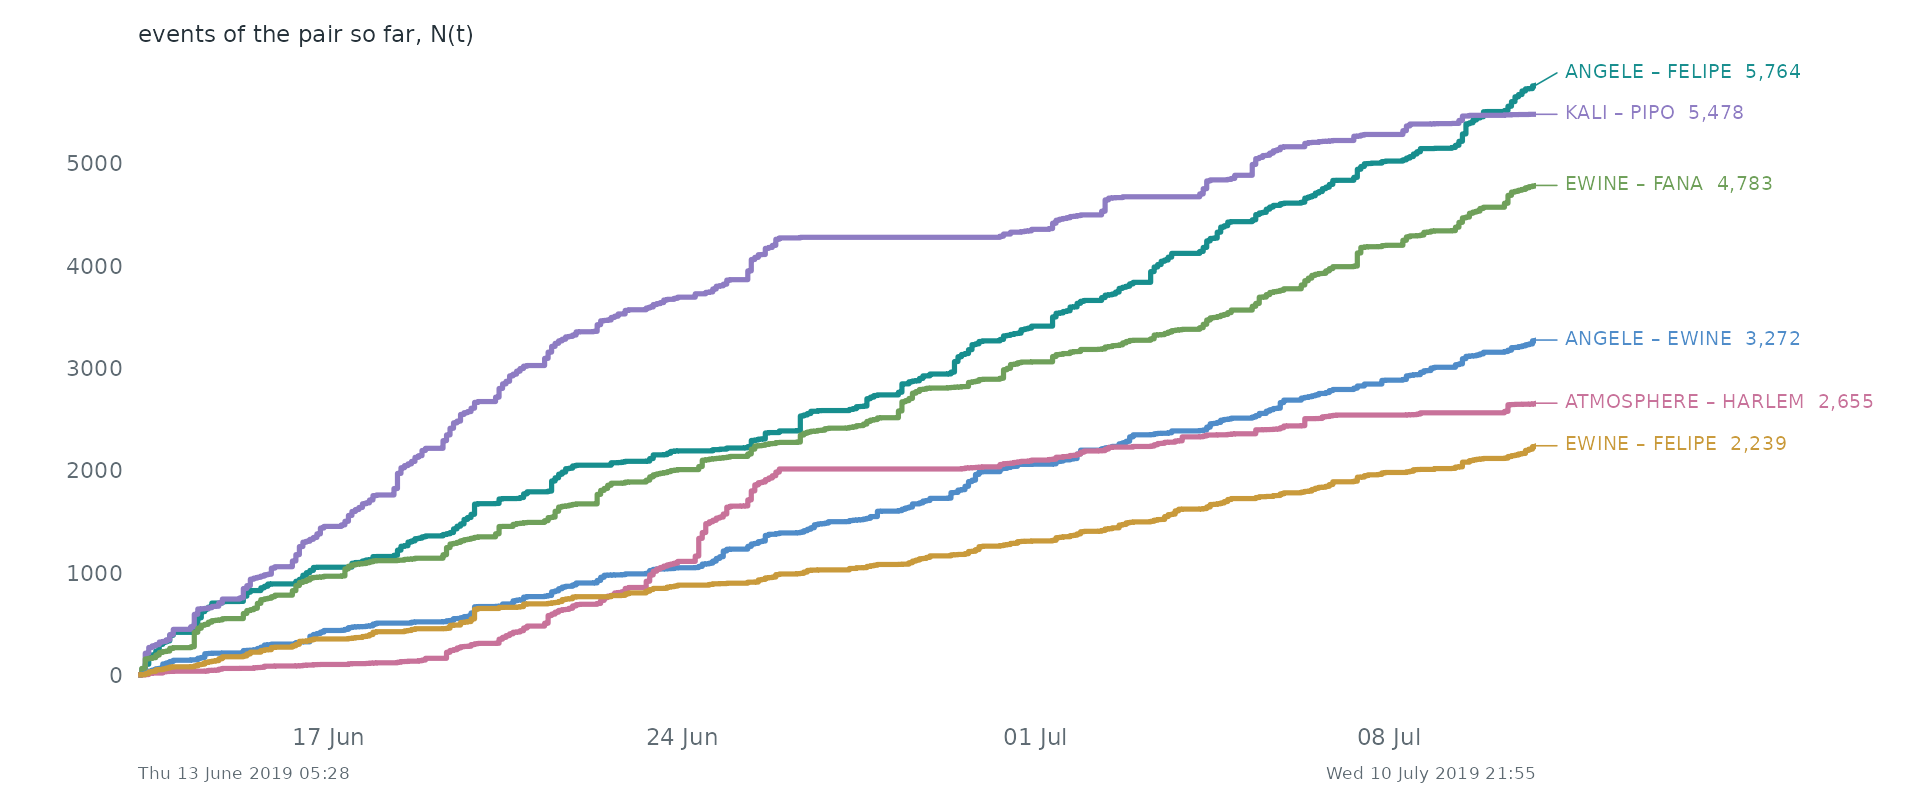
Pairs as counting processes. The counting process N(t) of the 6 busiest pairs: the number of events of the pair up to time t. Together they make 38.3% of all events. Steep stretches are bursts and flat ones silences.
Statistical profile.
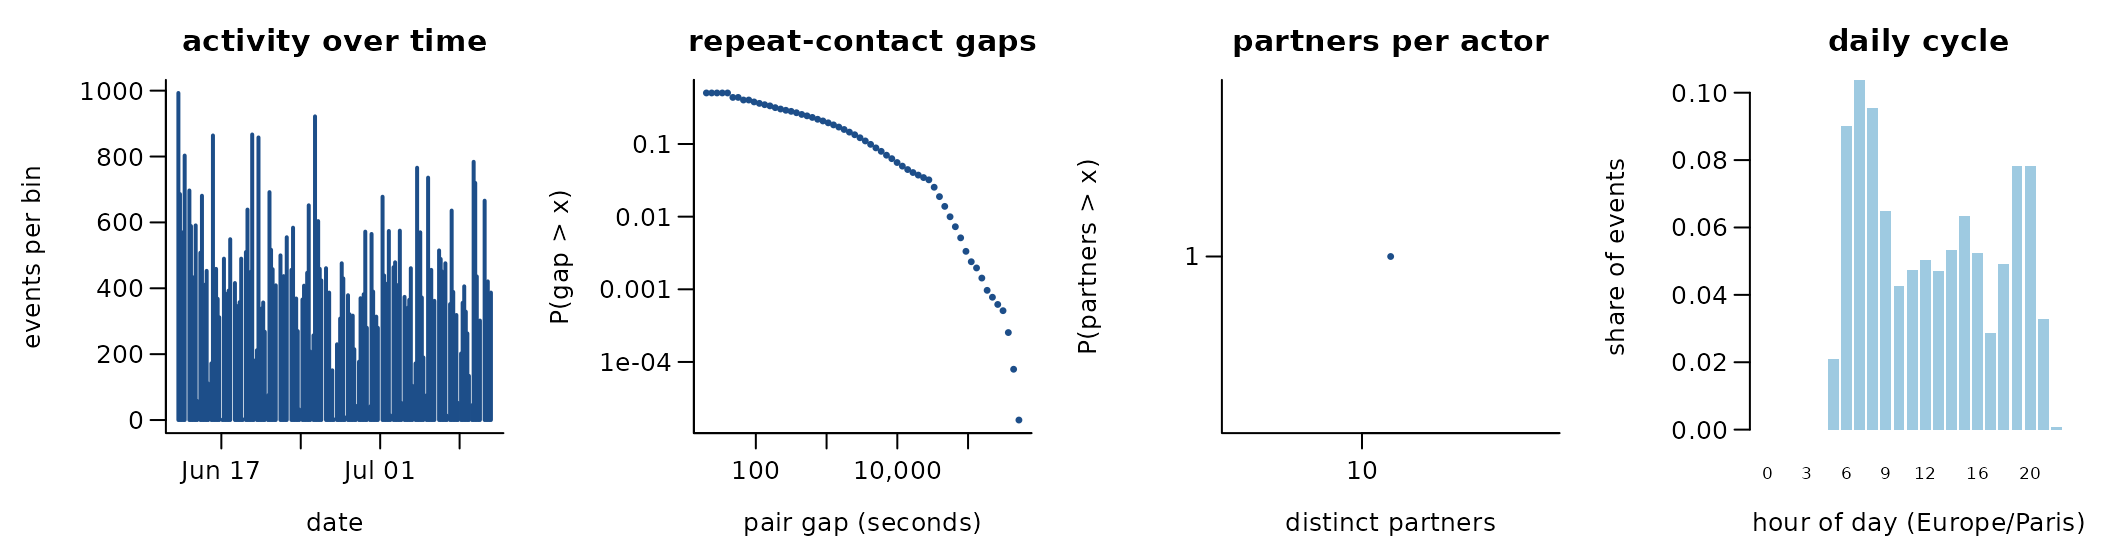
63,095 undirected contacts among 13 actors over 27.7 days (78 distinct pairs). 99.9% of events repeat an earlier pair; if every event chose a pair at random the share would be 99.9%. The burstiness coefficient of the gaps between successive events of the same pair is 0.67 (0 for a Poisson process, positive when events cluster in bursts); the most active tenth of the actors take part in 26.0% of events (Gini 0.24). 35.3% of events share their time stamp with an earlier one. Unix time; Guinea baboons, CNRS primate centre, Rousset, June-July 2019
Get the data
download.file("https://sociopatterns.org/assets/data/baboons_obs_data.txt.gz", "baboons_obs_data.txt.gz", mode = "wb")
download.file("https://sociopatterns.org/assets/data/baboons_proximity_data.txt.gz", "baboons_proximity_data.txt.gz", mode = "wb")
A reader that turns these files into a
(sender, receiver, time) table is
readers[["sp-baboons"]] in data-raw/catalogue/readers.R.
Honeybee trophallaxis interactions (Gernat et al. 2018)
Source: https://beemonitoring.igb.illinois.edu/ · Licence: none stated for data (software AGPL-3) · Status in amorem: no licence stated: not redistributed; obtain from the source.
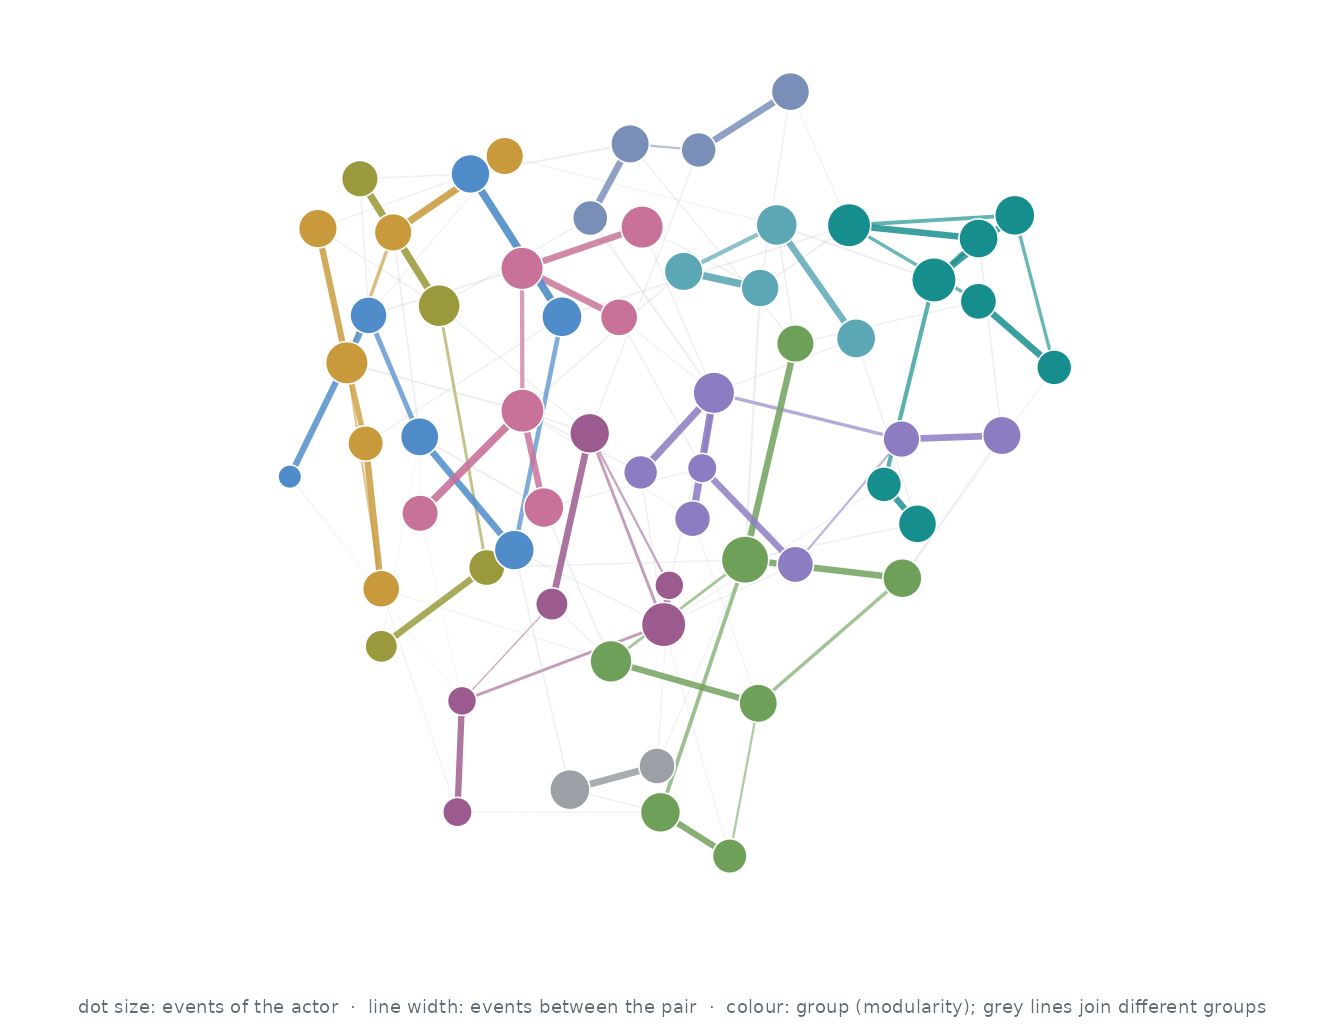
Who interacts with whom. The 60 actors of the busiest pairs, out of 1,164; events between two of them are 0.5% of all events. Each actor’s three strongest ties are drawn (121 of 685 pairs that ever interacted): wider, darker lines carry more events, larger dots are more active actors, and colours are groups found by modularity (Louvain).
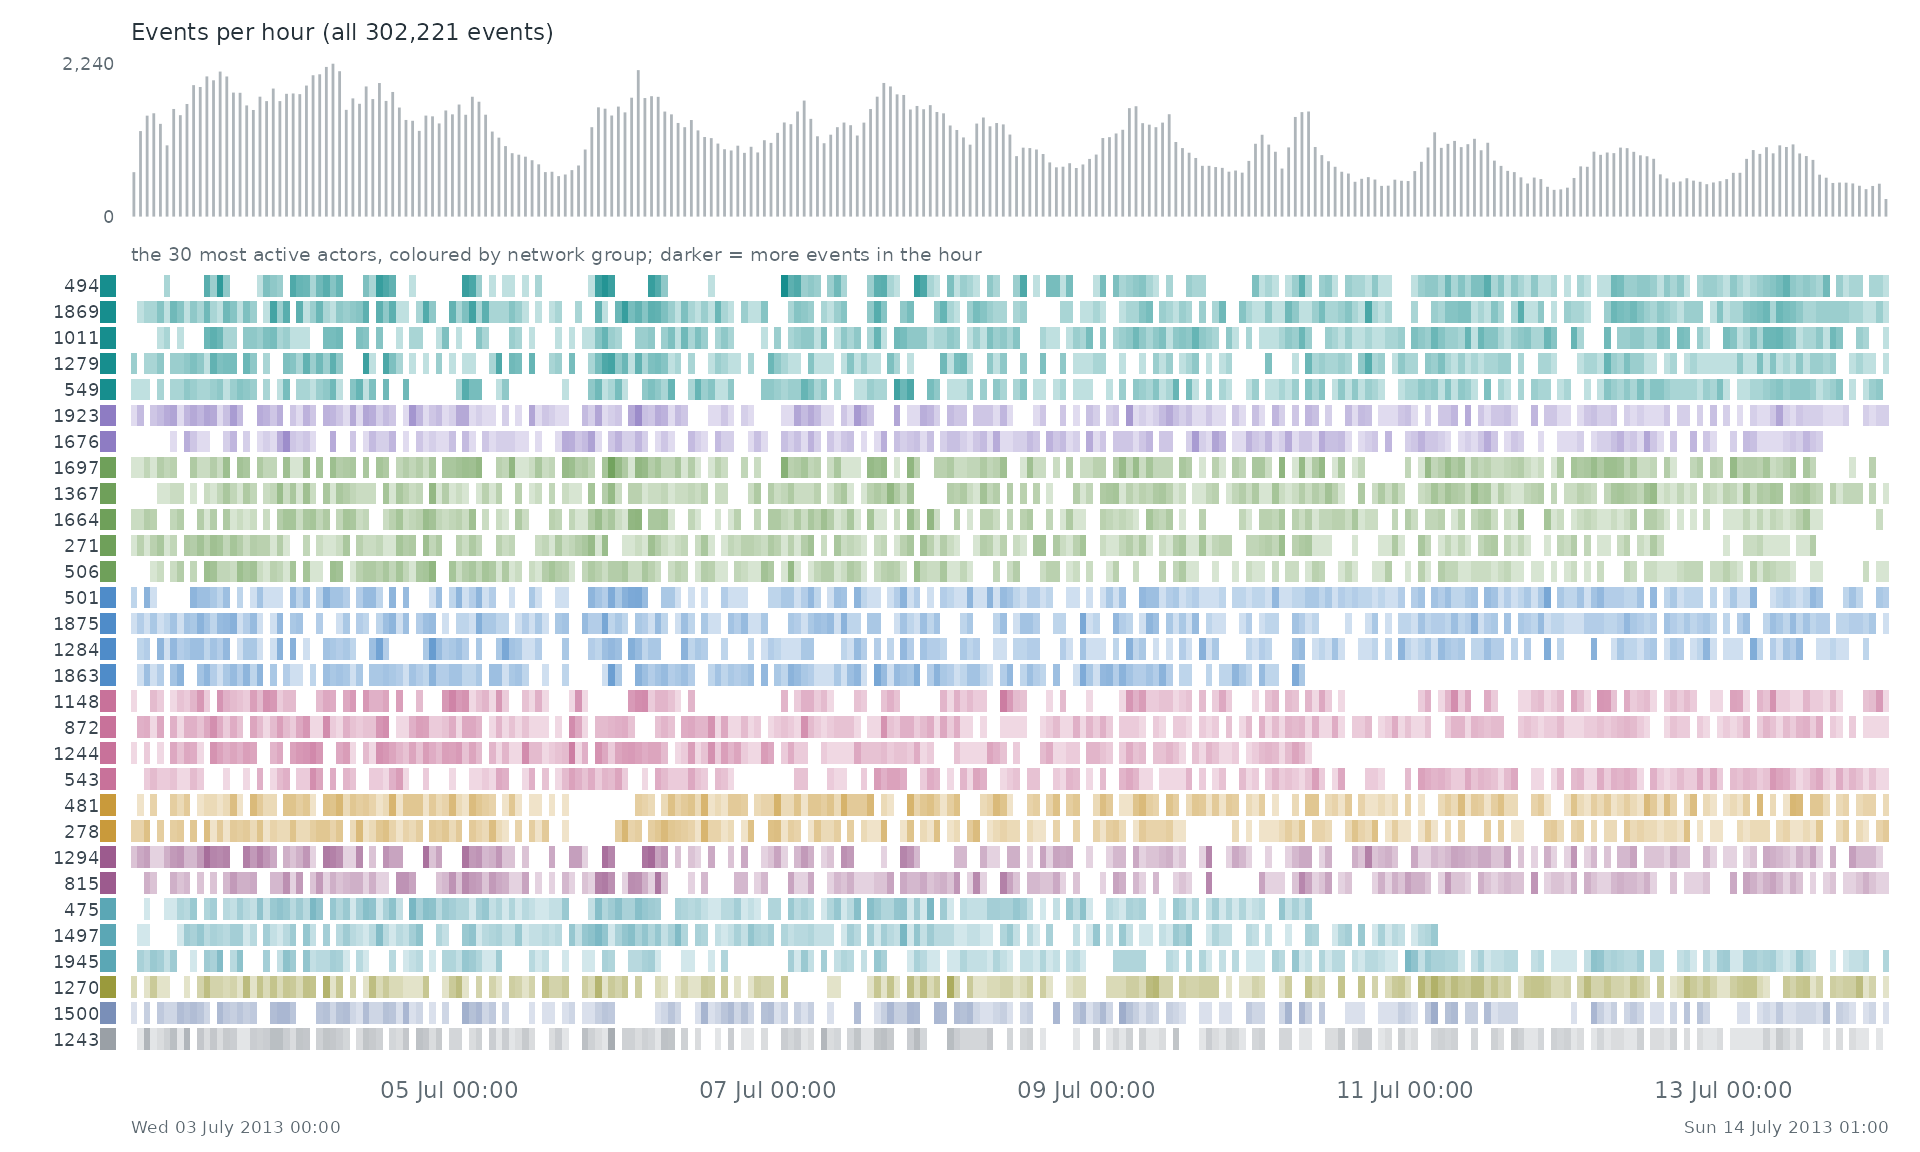
When. Each row is one of the 30 most active actors of the network, coloured by its group there; a cell is darker the more events (with anyone) the actor took part in during that stretch of time. The grey bars on top count all 302,221 events.
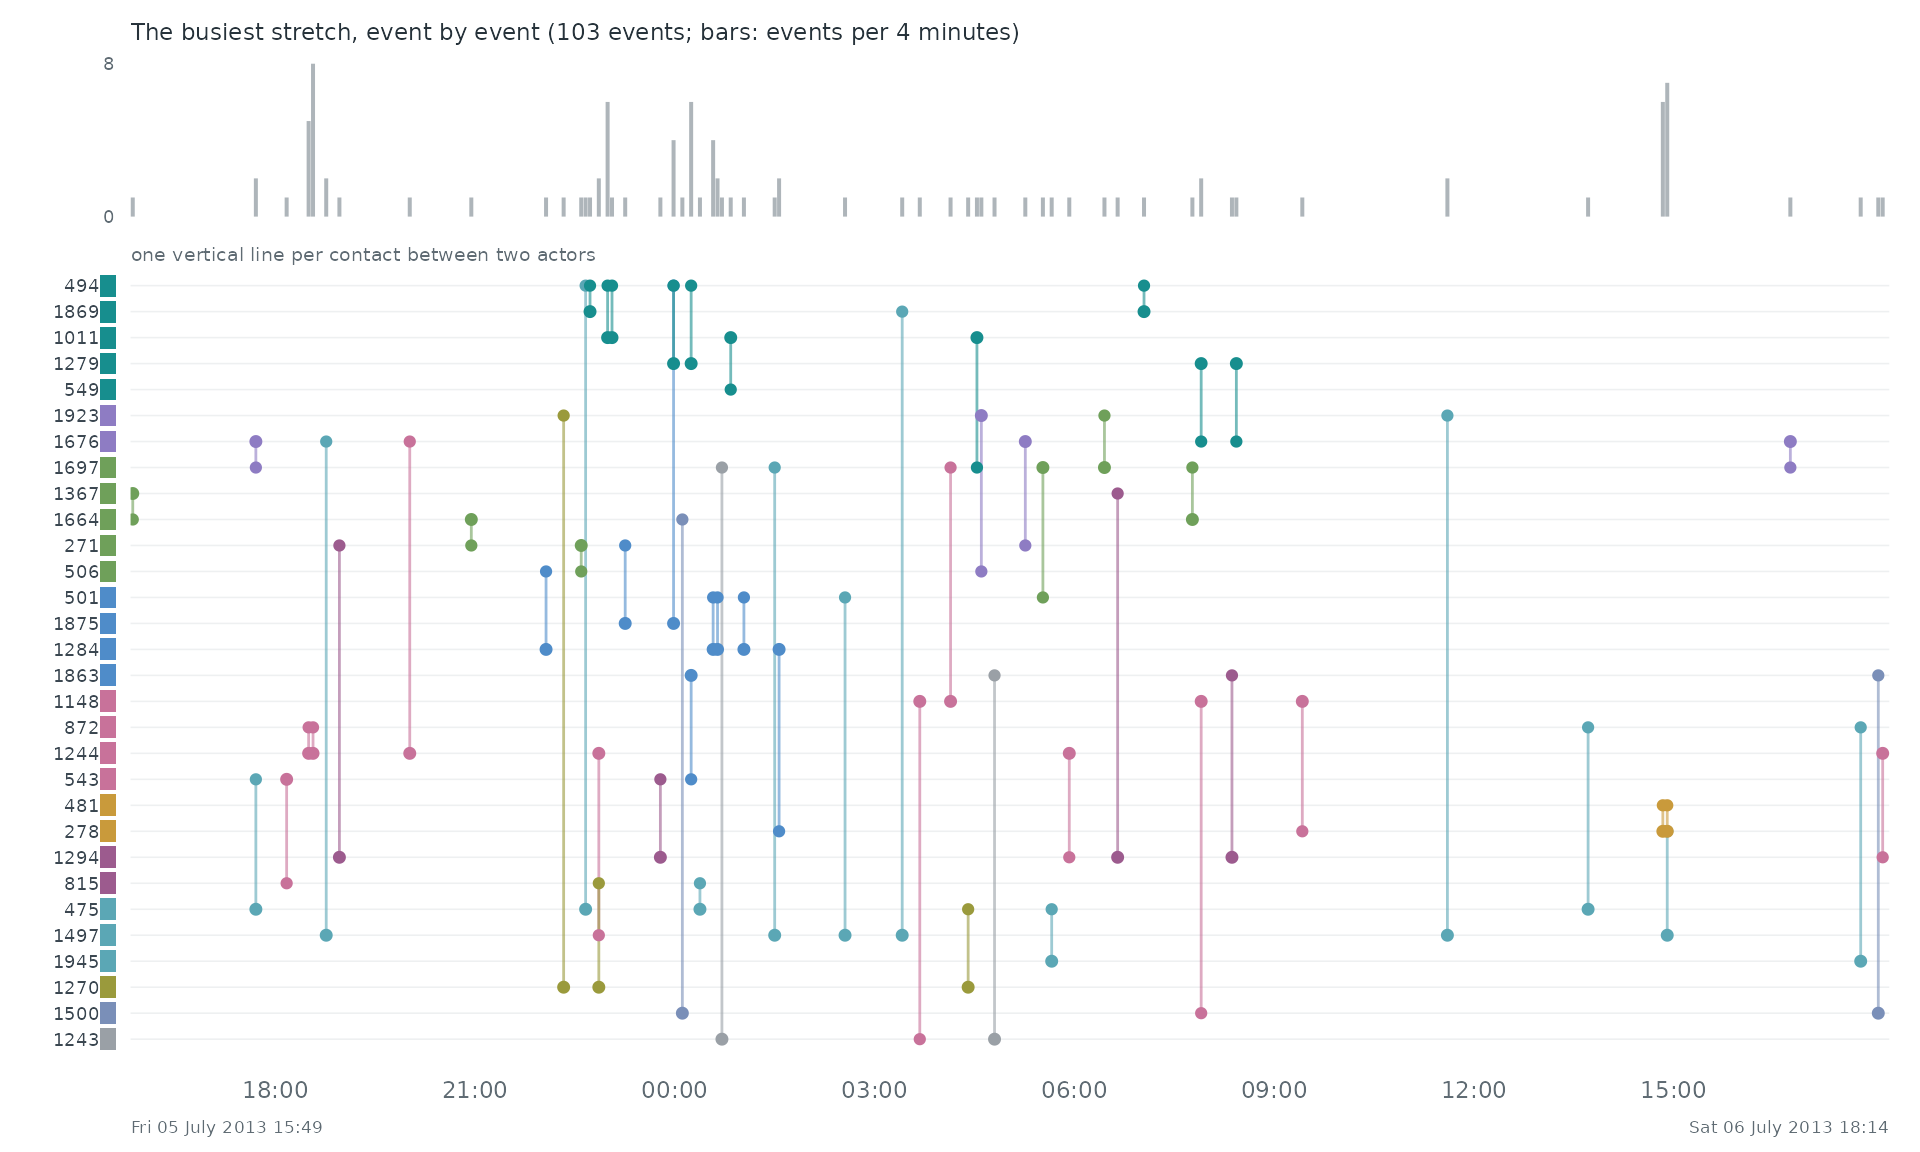
Event by event. The busiest stretch of the record, Fri 05 July 2013 15:49 to Sat 06 July 2013 18:14, event by event: each vertical line is one event between two of the actors above.
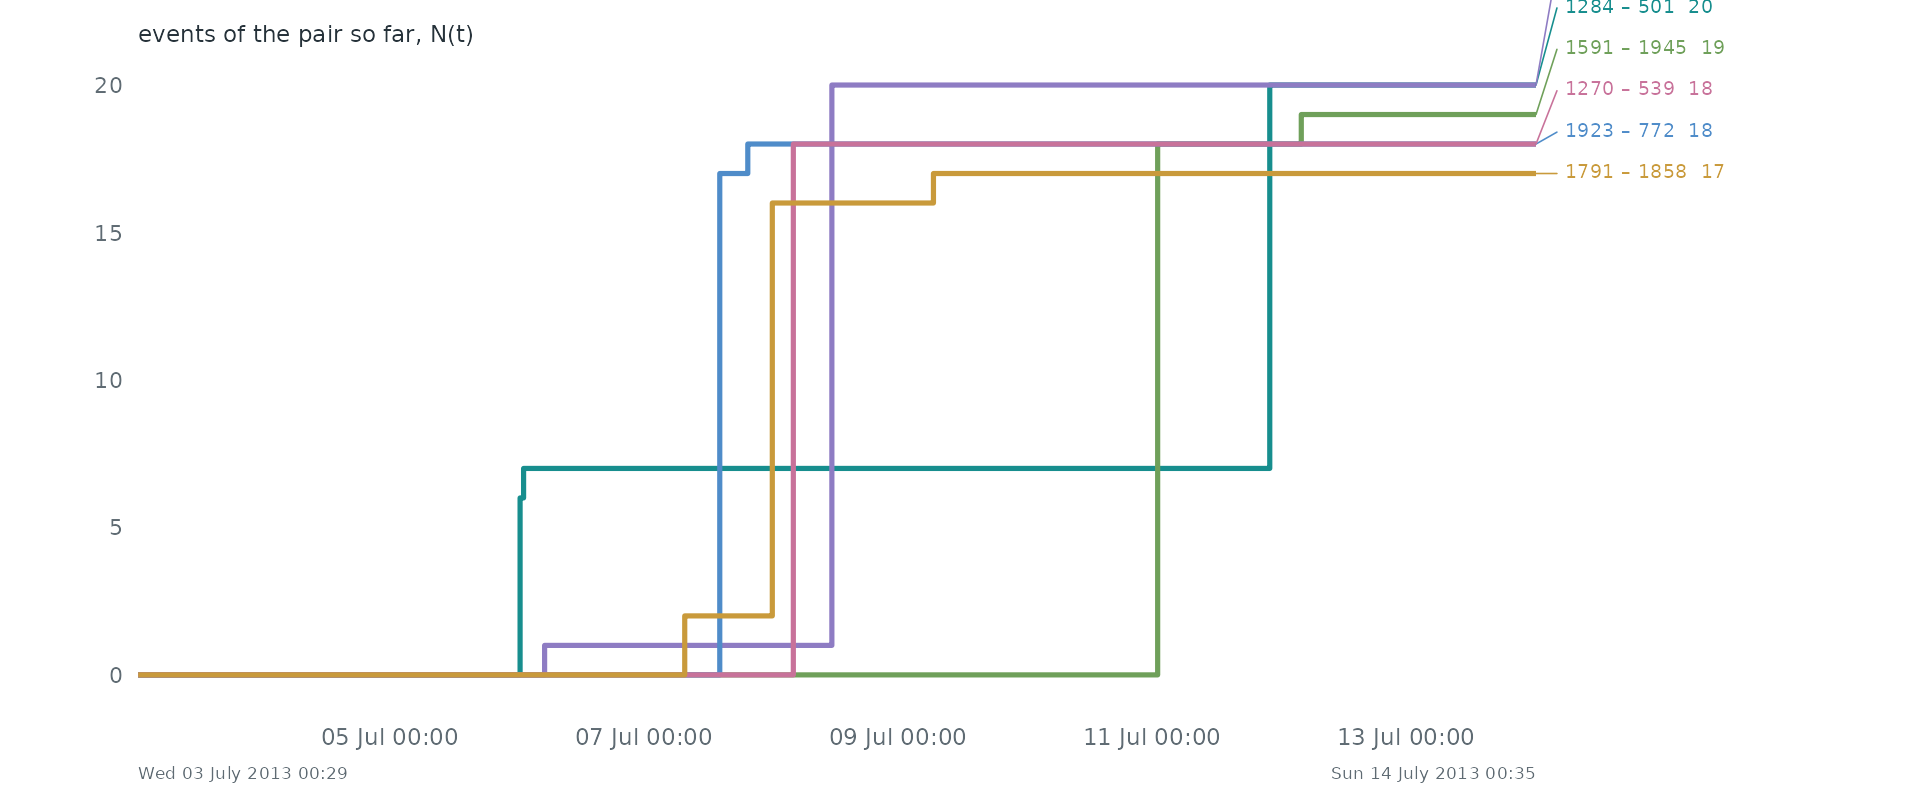
Pairs as counting processes. The counting process N(t) of the 6 busiest pairs: the number of events of the pair up to time t. Together they make 0.0% of all events. Steep stretches are bursts and flat ones silences.
Statistical profile.
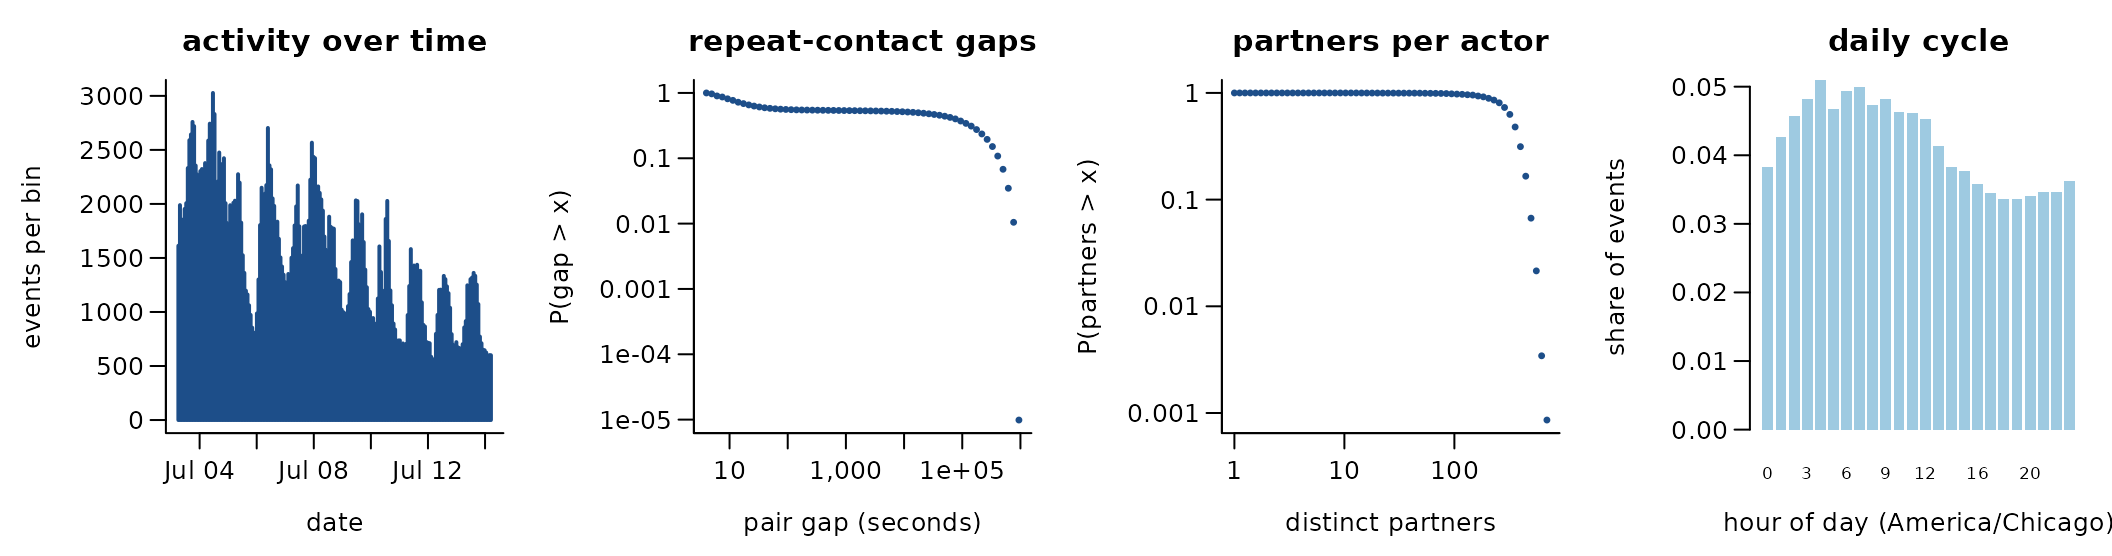
302,221 undirected contacts among 1,164 actors over 11.0 days (200,723 distinct pairs). 33.6% of events repeat an earlier pair; if every event chose a pair at random the share would be 19.3%. The burstiness coefficient of the gaps between successive events of the same pair is 0.20 (0 for a Poisson process, positive when events cluster in bursts); the most active tenth of the actors take part in 17.0% of events (Gini 0.21). trial 1 of 5: trophallaxis contacts, start times
Get the data
download.file("https://beemonitoring.igb.illinois.edu/trial1.zip", "trial1.zip", mode = "wb")
download.file("https://beemonitoring.igb.illinois.edu/trial2.zip", "trial2.zip", mode = "wb")
download.file("https://beemonitoring.igb.illinois.edu/trial3.zip", "trial3.zip", mode = "wb")
download.file("https://beemonitoring.igb.illinois.edu/trial4.zip", "trial4.zip", mode = "wb")
download.file("https://beemonitoring.igb.illinois.edu/trial5.zip", "trial5.zip", mode = "wb")
A reader that turns these files into a
(sender, receiver, time) table is
readers[["honeybee-trophallaxis-gernat2018"]] in data-raw/catalogue/readers.R.
KONECT: Haggle device contacts
Source: http://konect.cc/ · Licence: unknown (site unreachable 2026-10-17) · Status in amorem: no licence stated: not redistributed; obtain from the source.
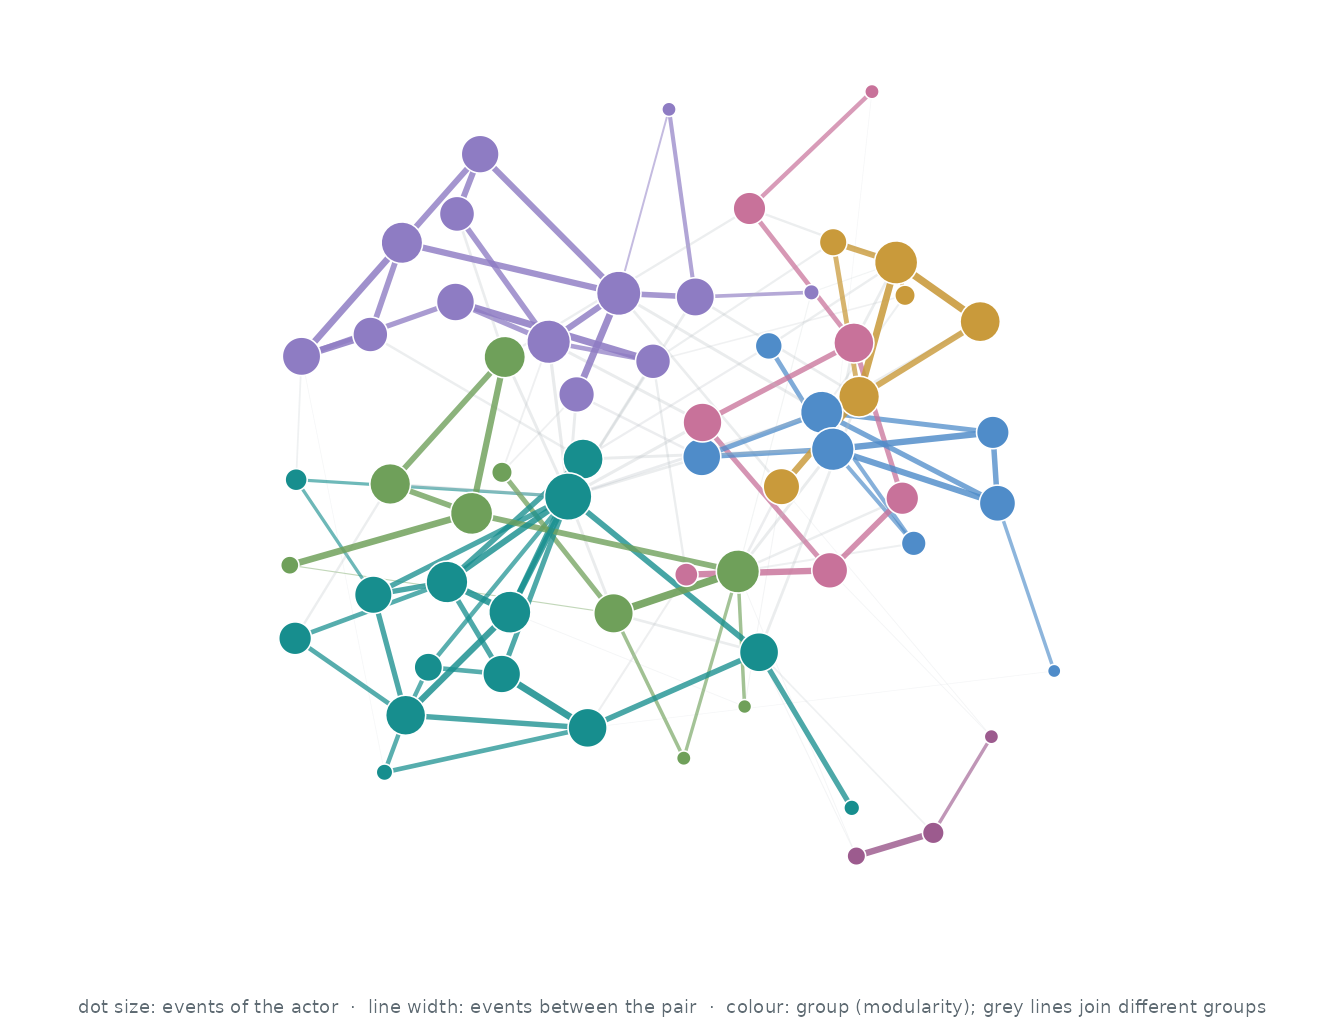
Who interacts with whom. The 60 actors of the busiest pairs, out of 274; events between two of them are 92.1% of all events. Each actor’s three strongest ties are drawn (135 of 1,161 pairs that ever interacted): wider, darker lines carry more events, larger dots are more active actors, and colours are groups found by modularity (Louvain).
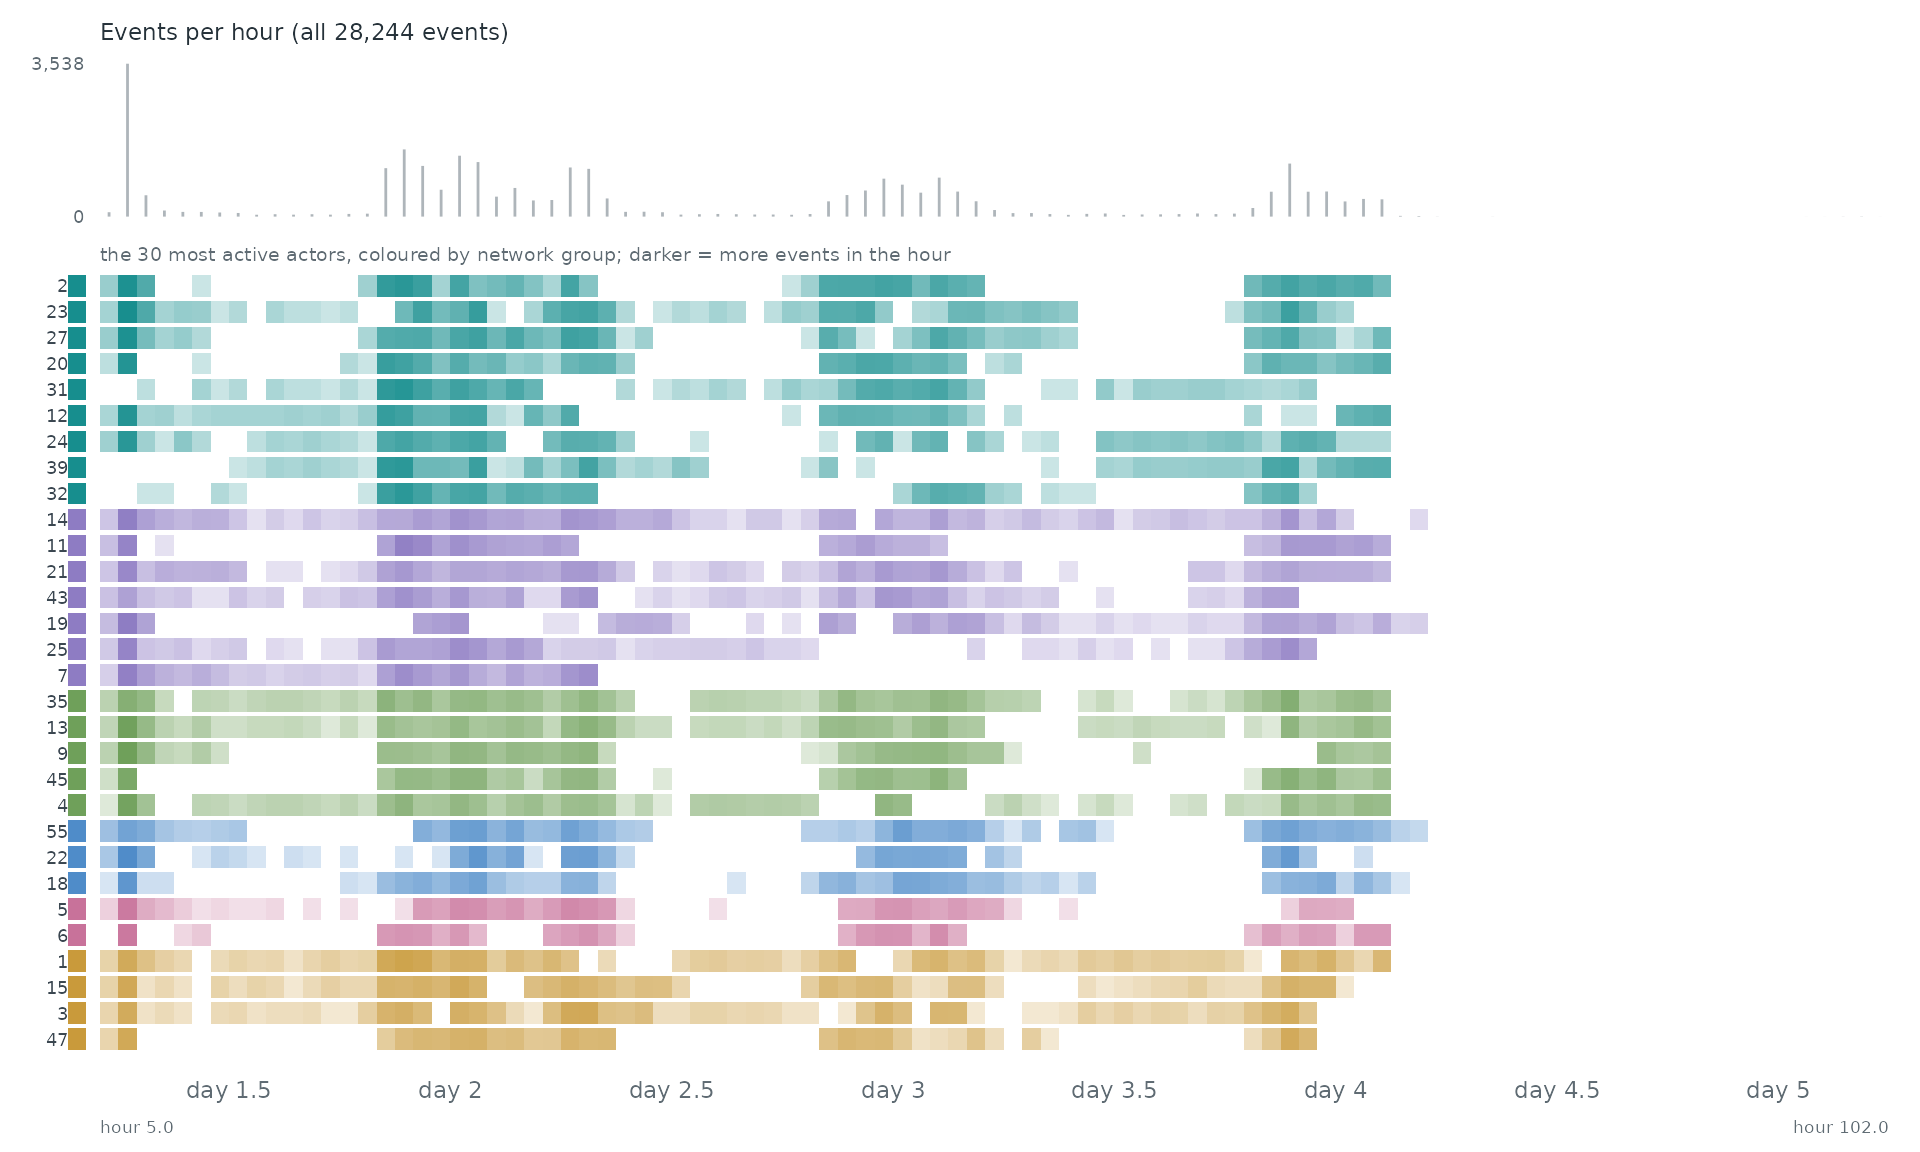
When. Each row is one of the 30 most active actors of the network, coloured by its group there; a cell is darker the more events (with anyone) the actor took part in during that stretch of time. The grey bars on top count all 28,244 events.
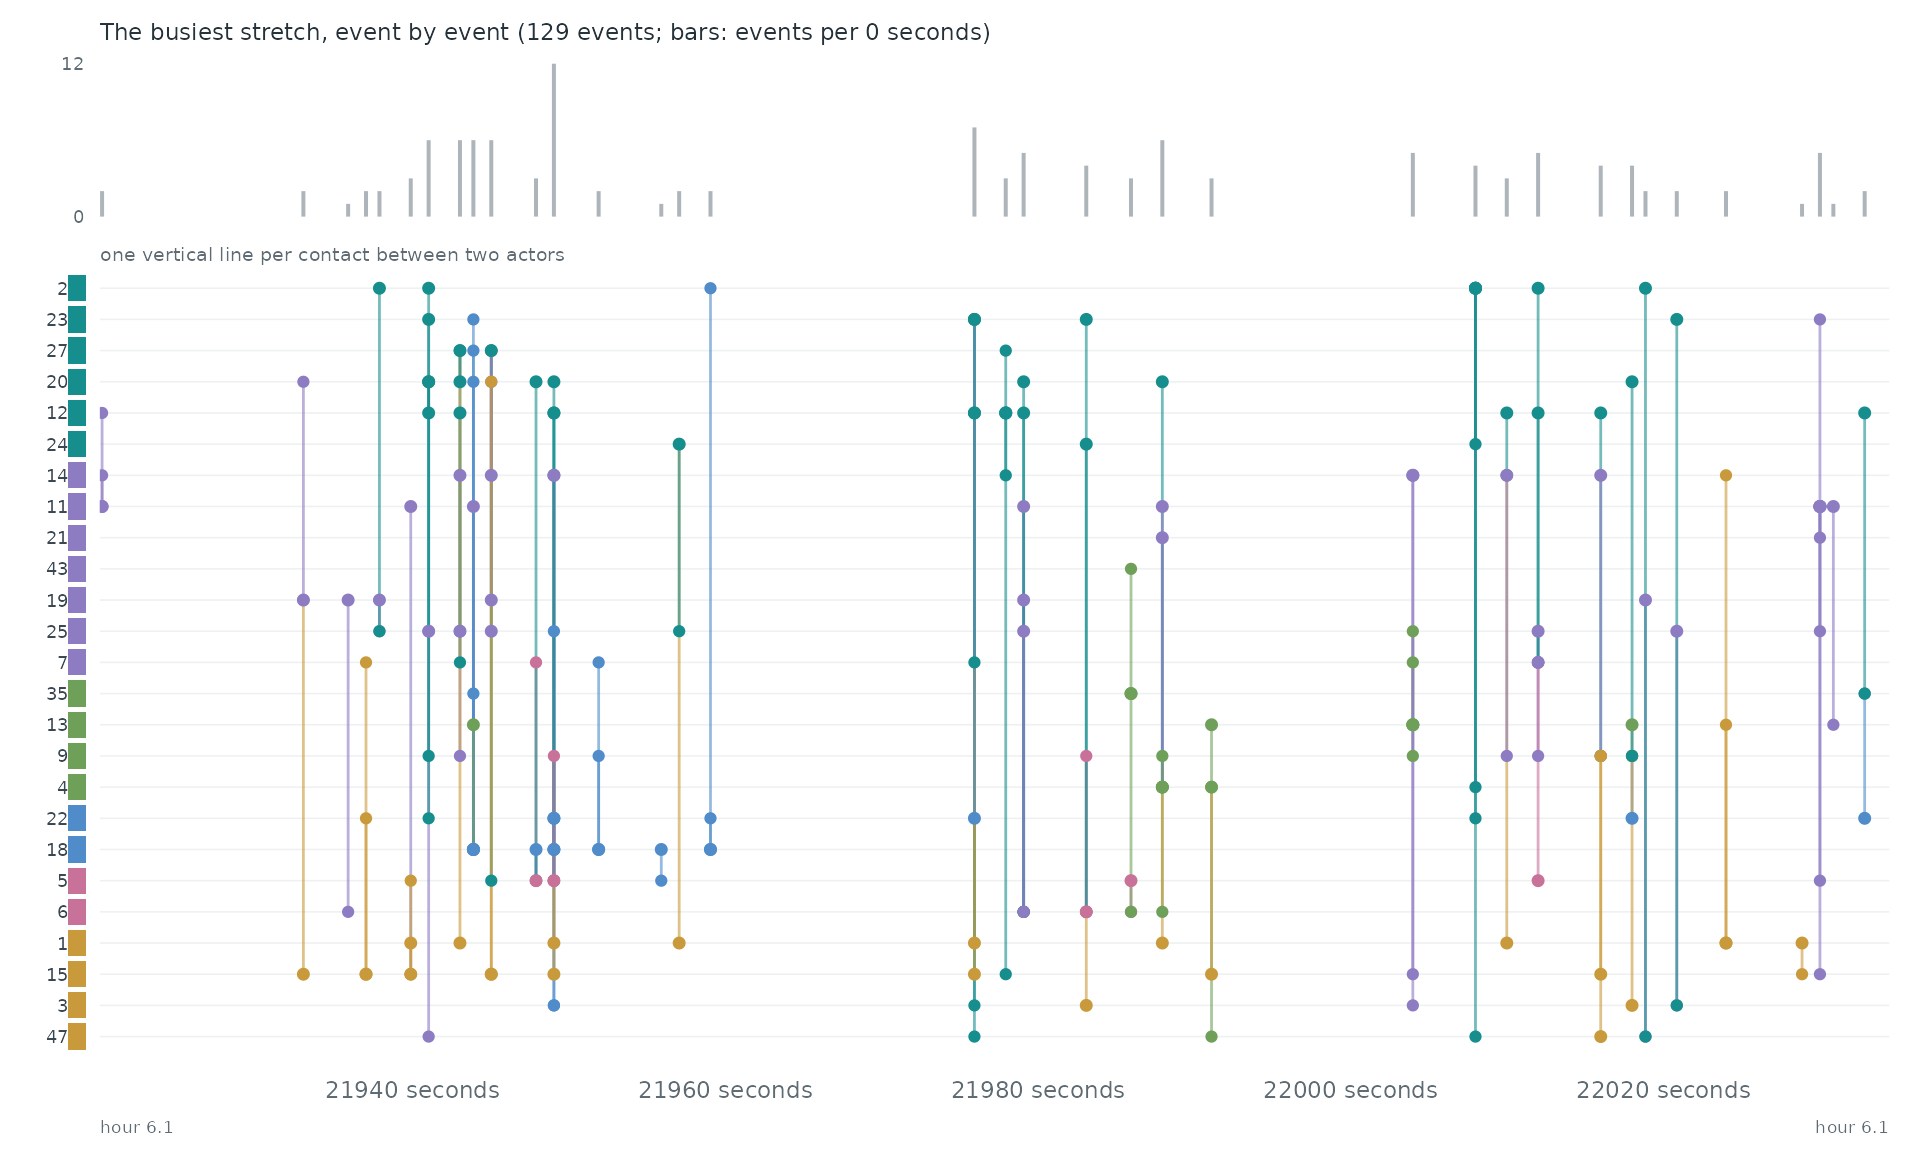
Event by event. The busiest stretch of the record, hour 6.1 to hour 6.1, event by event: each vertical line is one event between two of the actors above.
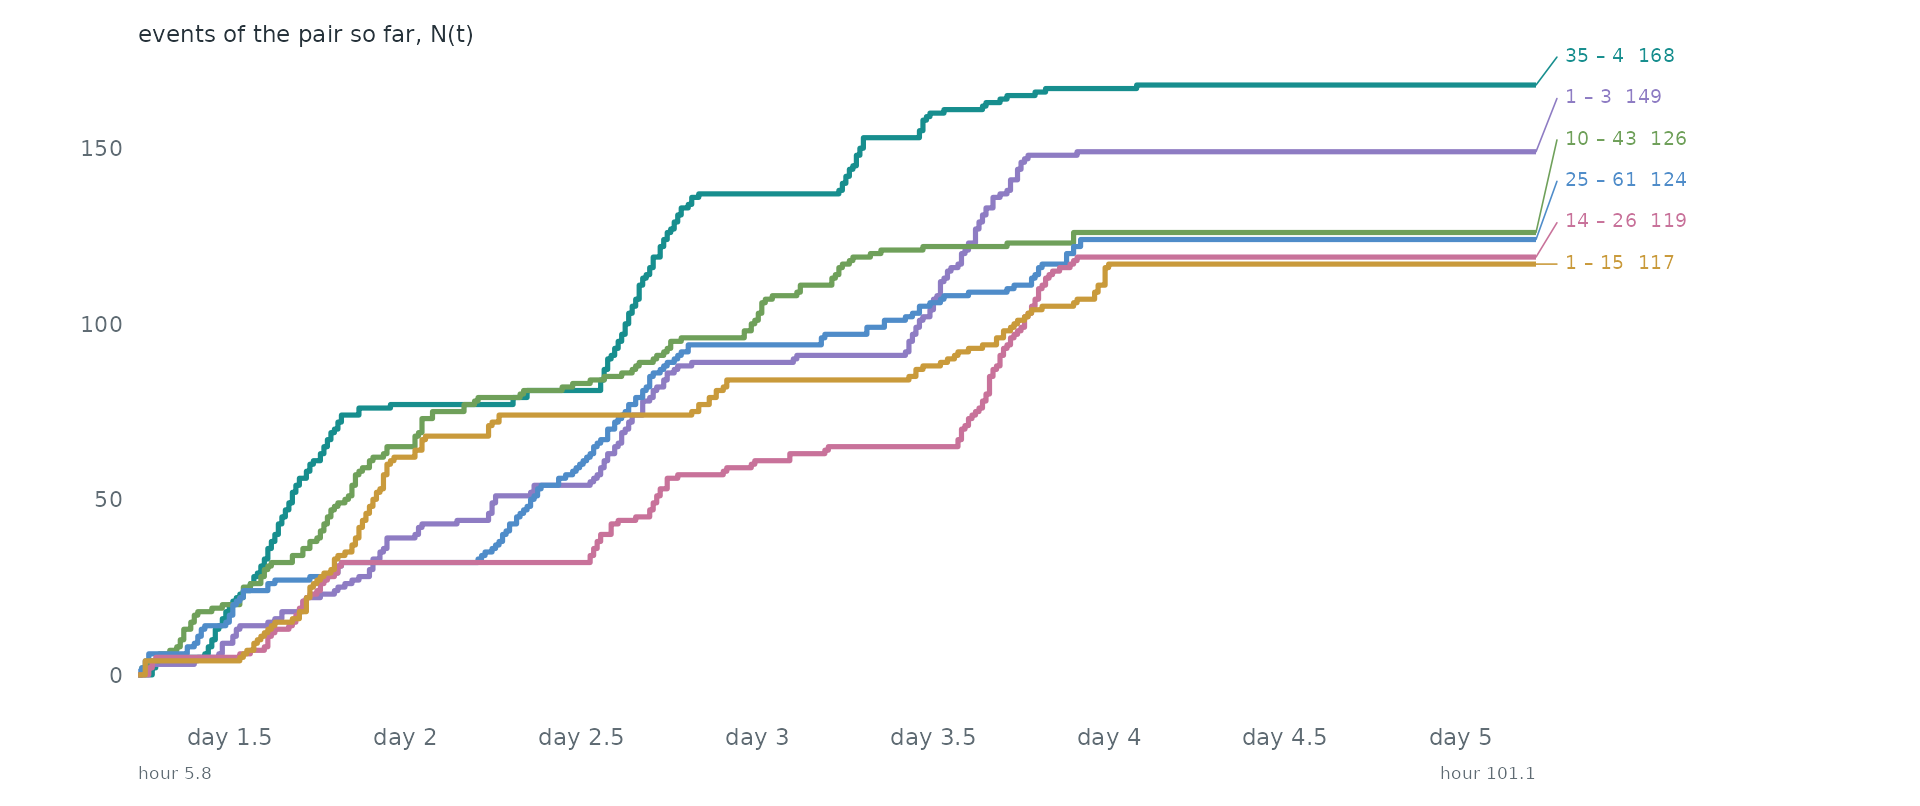
Pairs as counting processes. The counting process N(t) of the 6 busiest pairs: the number of events of the pair up to time t. Together they make 2.8% of all events. Steep stretches are bursts and flat ones silences.
Statistical profile.
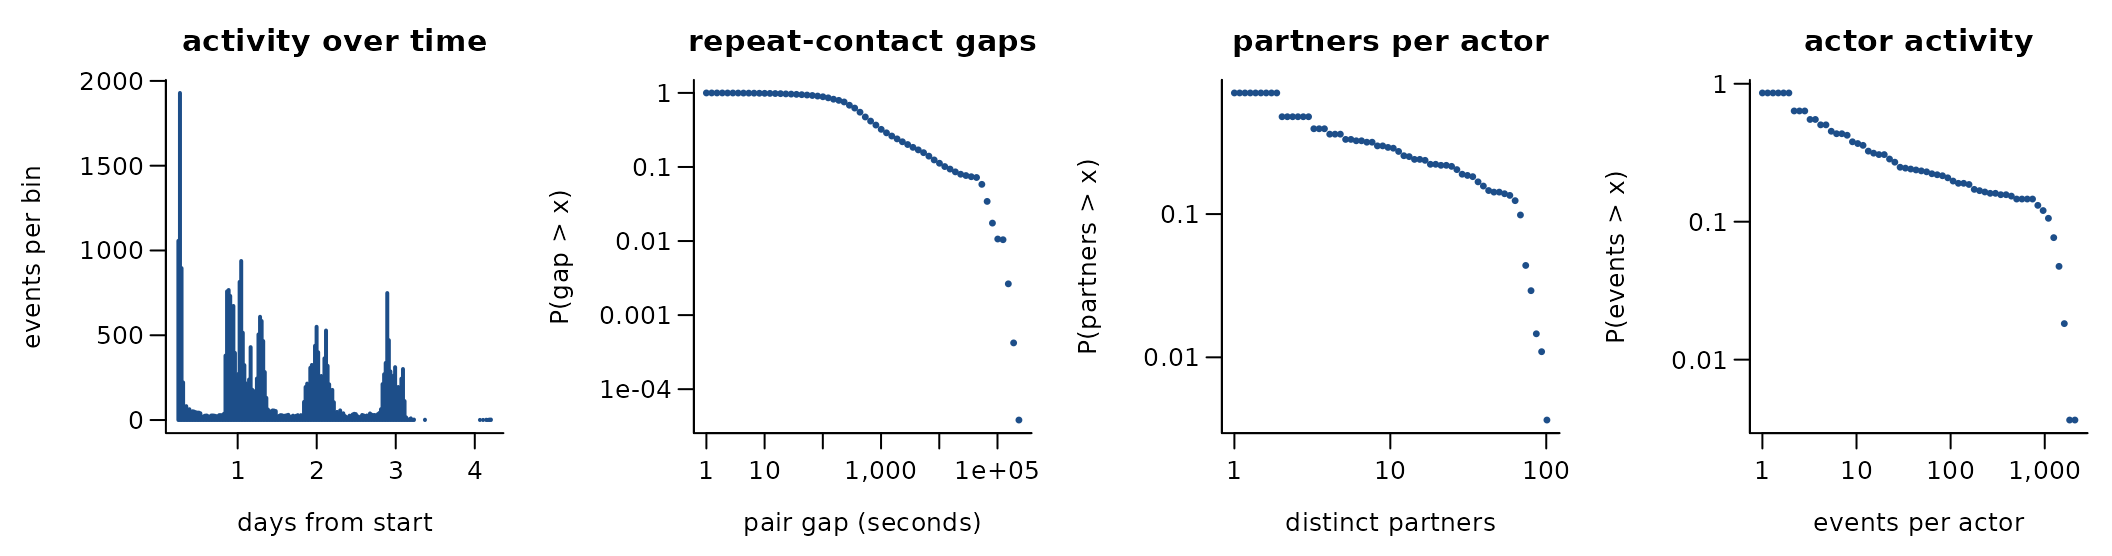
28,244 undirected contacts among 274 actors over 4.0 days (2,124 distinct pairs). 92.5% of events repeat an earlier pair; if every event chose a pair at random the share would be 29.8%. The burstiness coefficient of the gaps between successive events of the same pair is 0.50 (0 for a Poisson process, positive when events cluster in bursts); the most active tenth of the actors take part in 70.7% of events (Gini 0.84). 44.5% of events share their time stamp with an earlier one. Bluetooth device contacts, Infocom 2005
Get the data
download.file("http://konect.cc/files/download.tsv.contact.tar.bz2", "download.tsv.contact.tar.bz2", mode = "wb")A reader that turns these files into a
(sender, receiver, time) table is
readers[["konect-haggle"]] in data-raw/catalogue/readers.R.